

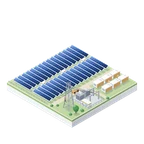
 Utility
 Wind
Wind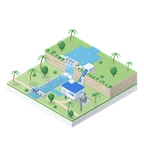 Hydro
Hydro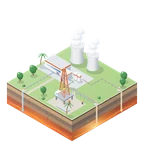 Geothermal
 Village
 Behavioural Twin
 Agri
Agri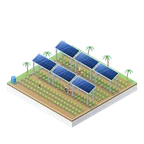 Agrivoltaics
 Aqua
Aqua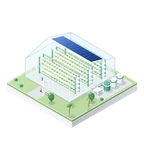 Hydroponics
 Telco
Telco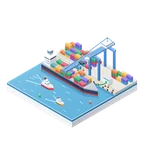 Marine
 Supply Chain
 Portfolio
 Jarvis
Fifteen modules.
One engine.
Clean power, energy access, food, water, connectivity and trade. Every module runs on the same engine, shares the same data and produces the same class of evidence, down to its carbon ledger and the goals it serves.
Five pillars.
One engine under all of them.
Each module is a full workspace with its own data, models and exports. They share the resource, finance, provenance and AI core, so a site that needs three of them is one place with three analyses, in one dossier.
Clean power
Generation that does not burn anything, sited and sized from the resource up.
SDG 7 · 13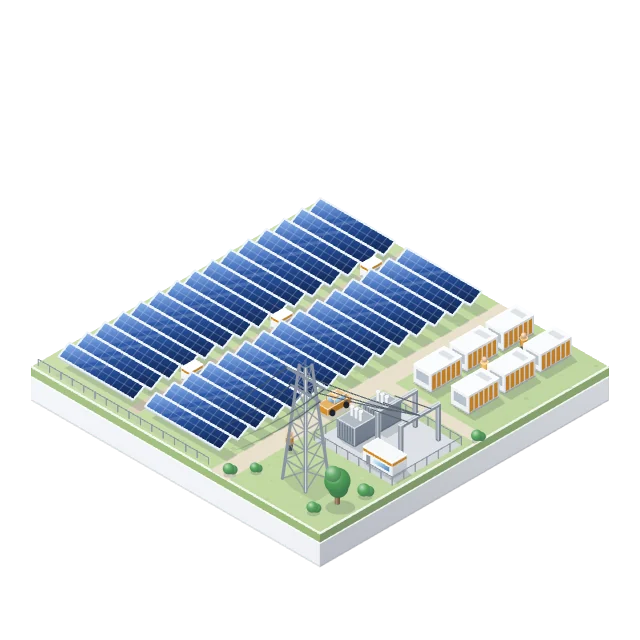
Energy access
Power for the communities the grid has not reached, and proof of what changed.
SDG 1 · 7 · 10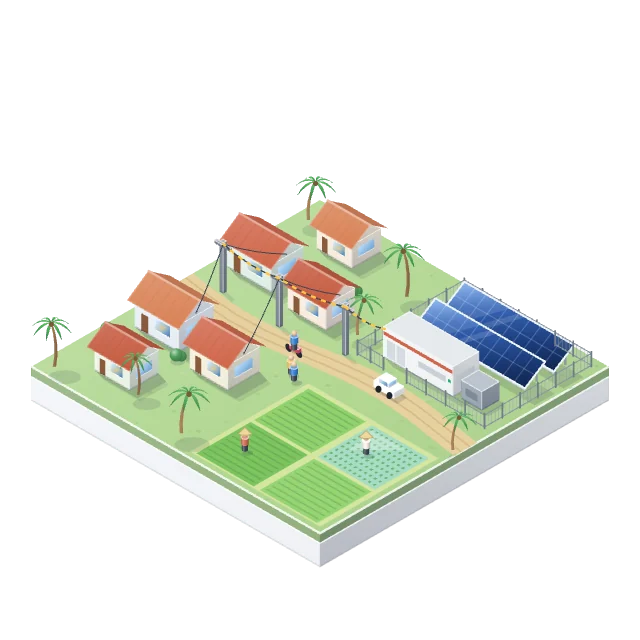
Food, land & water
Food and water produced with the energy they need, on land that stays productive.
SDG 2 · 6 · 14 · 15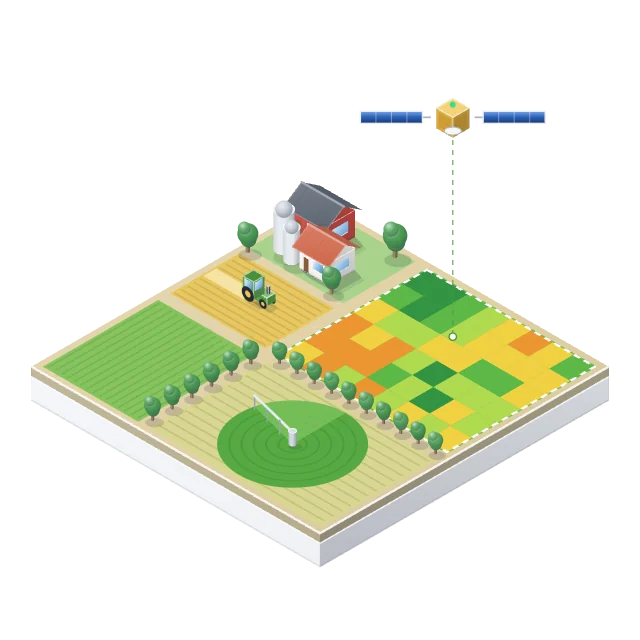
Connectivity & trade
The towers, ports and supply chains a low-carbon economy runs on.
SDG 9 · 12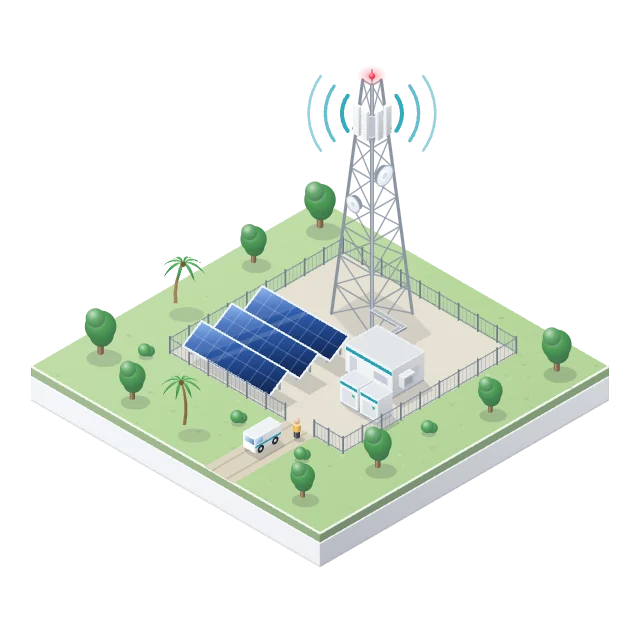
Intelligence & impact
The layer that runs a fleet, answers questions and keeps every claim honest.
SDG 13 · 17Clean power
Generation that burns nothing, sited and sized from the resource up. Utility-scale solar and storage has its own page →
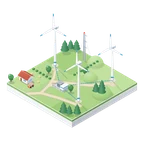
Wind, sited
turbine by turbine.
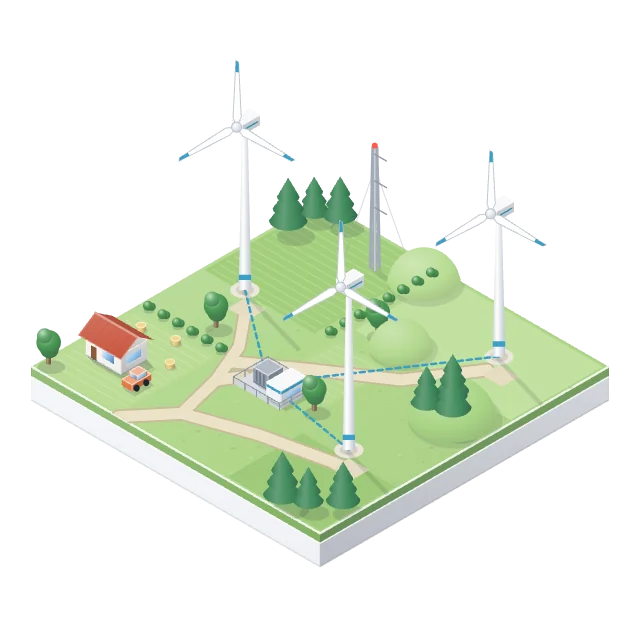
Click anywhere in Southeast Asia and get the wind resource, the turbine that suits it and the energy it will yield, net of losses. Then lay out a small farm and see what each turbine costs its neighbours in wake.
- Wind resource at 50, 100, 150 and 200 m hub heights
- Mean speed, capacity factor and power density layers
- One click for a turbine’s gross and net annual energy
- Turbines and hub heights compared side by side
- Farm layouts with wake losses checked against a reference model
Screening grade, across the ten ASEAN countries and Timor-Leste. Time-series P50/P90 and project finance are next.
Run-of-river,
from a pin on the river.
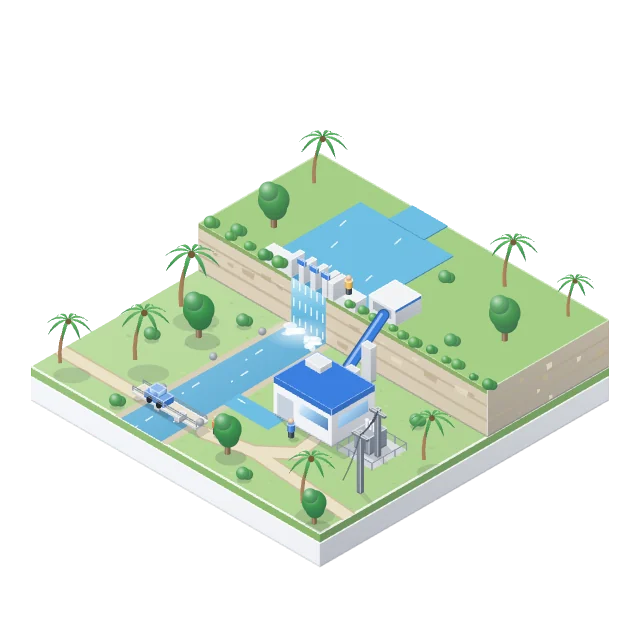
Drop a pin on a river. The catchment is traced from terrain, the flow is estimated and graded for confidence, and a weir, waterway, penstock and powerhouse are designed and costed, with the early-stage economics beside them.
- Catchment traced from terrain in seconds
- Flow-duration curve with an A to E confidence grade
- Weir, waterway, penstock and powerhouse designed automatically
- Early-stage CAPEX, LCOE, NPV and IRR under national tariff rules
- A 3D view of the scheme and a one-page summary
Early access, Indonesia first. Detailed design, lender finance and a regional site atlas are next.
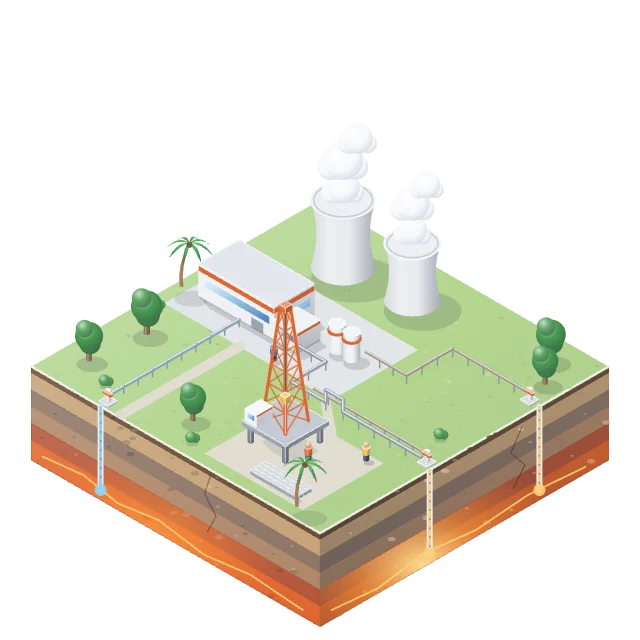
Heat, screened
before drilling.
Find where underground heat is most likely to be commercially drillable, size the resource statistically and show whether one more exploration well is worth paying for.
- Nine-stage pipeline from region to drill target
- Play-fairway scoring across heat, permeability and fluid evidence
- Standards-based volumetric Monte Carlo at P90, P50 and P10
- Drill targeting with value-of-information analysis
- Cross-section and 3D conceptual model with specialist export
Energy access
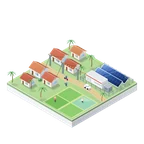
Power for the communities the grid has not reached, and proof of what changed. Village mini-grids have their own page →
Measure impact.
Do not assert it.
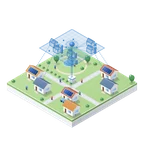
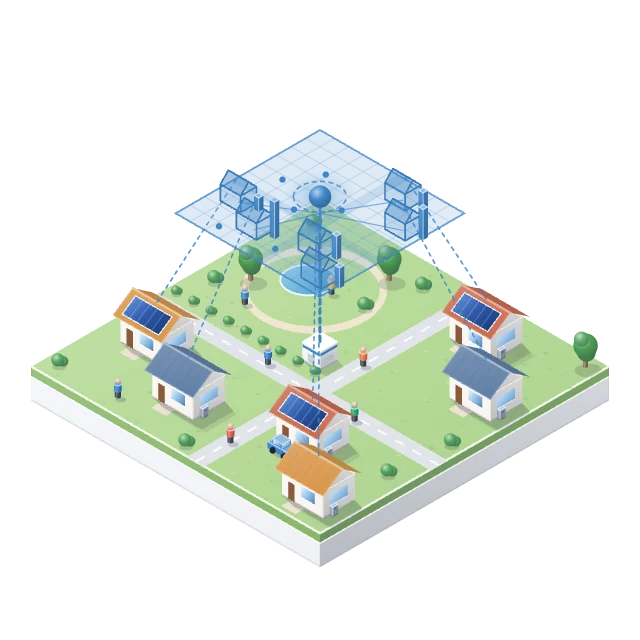
Simulate how a village's households and businesses actually behave before and after electrification. Every result is signed and labelled as live, replayed or synthetic, so nobody can pass a demo off as evidence.
- Agent-based simulation with synthesised personas
- Paired counterfactual arms with a placebo test
- Hold-out back-testing: fit on eight months, predict four
- Knowledge graph with a 3D lattice and household view
- Signed indicator deltas under four impact frameworks
Food, land & water
Food and water produced with the energy they need, on land that stays productive.
Every field,
every crop.
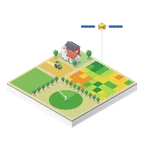
See what is growing on every farm parcel in the country and where farming and solar can share the same land. Size the electricity demand from irrigation pumps, mills and cold storage before anyone drills a borehole.
- Field boundaries with crop labels and seasonal calendars
- Agrivoltaic co-siting scored village by village
- Irrigation-pump electrification sizing
- Rice-methane abatement measured and reported
- Mill catchments and deforestation-regulation screening
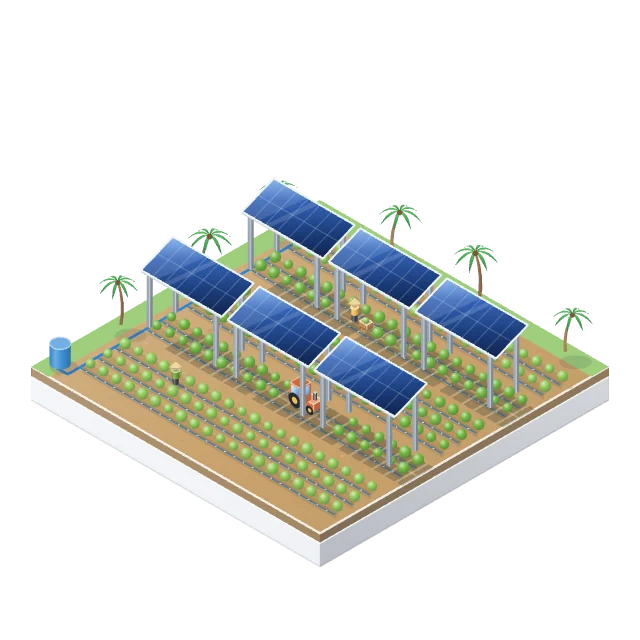
Food and power,
from the same field.
Draw or import a field, choose the crop and the structure, and see the light, shade and water under the panels hour by hour, with the energy, the crop yield and the land-use ratio side by side. Then price it: capital, the lender’s case and the farmer’s offer.
- Fields drawn or imported, anywhere on Earth
- Hourly light, shade and water modelled under the array
- Energy, crop yield and land-equivalent ratio side by side
- Capital cost, NPV, the lender’s debt case and a farmer offer
- Checked against national agrivoltaic rules, and shown in full 3D
Results are labelled indicative until the field has been measured.
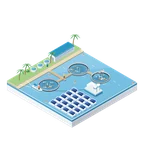
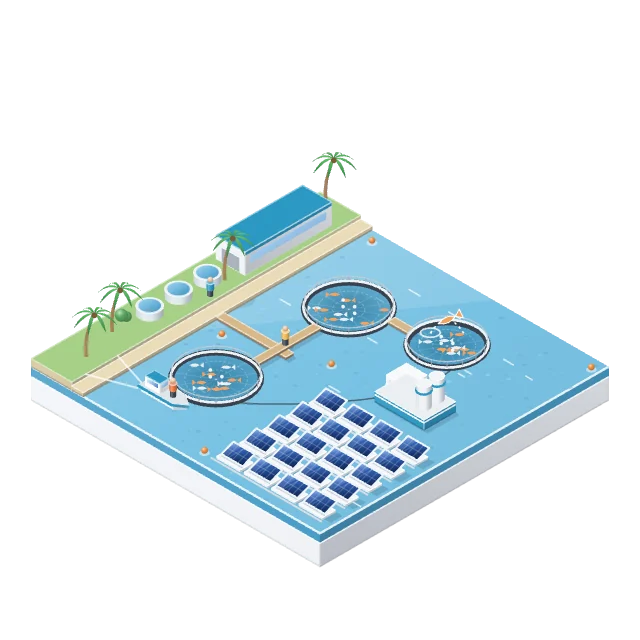
Aquaculture,
powered from the water up.
On the roadmap. Fish and shrimp farms screened and sized, with the aeration, pumping and cold chain they run on, and floating solar on the water they already have.
- Site screening for ponds, pens and recirculating tanks
- Aeration and pumping energy sized to the stock
- Cold-chain energy from harvest to market
- Floating solar on existing ponds and reservoirs
- The same finance and carbon ledger as every module
Nothing in this module calculates yet. It will be built with the partners who use it first.
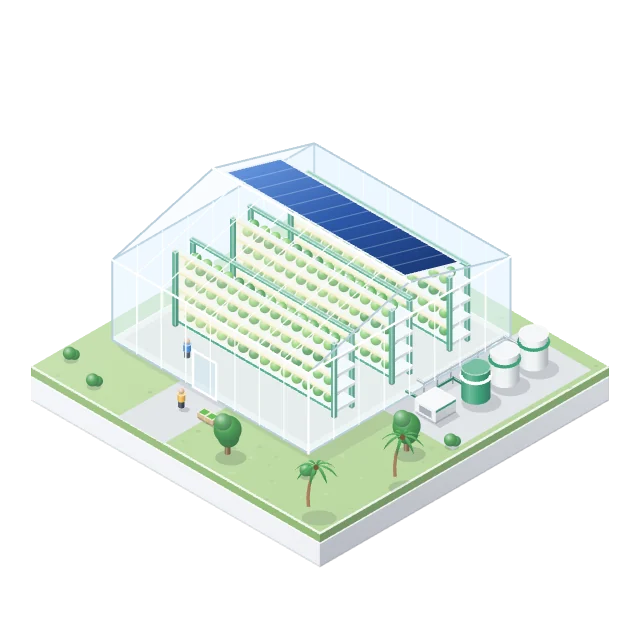
Soil-free growing,
designed end to end.
On the roadmap. Channels, racks, nutrients, lighting and climate laid out together, with the energy they draw and the crop cycles they return.
- NFT channel and vertical-rack layout
- Lighting and climate-control energy
- Nutrient and water loop planning
- Crop-cycle economics and yield
- Solar and storage sized to the grow room
Nothing in this module calculates yet. It will be built with the partners who use it first.
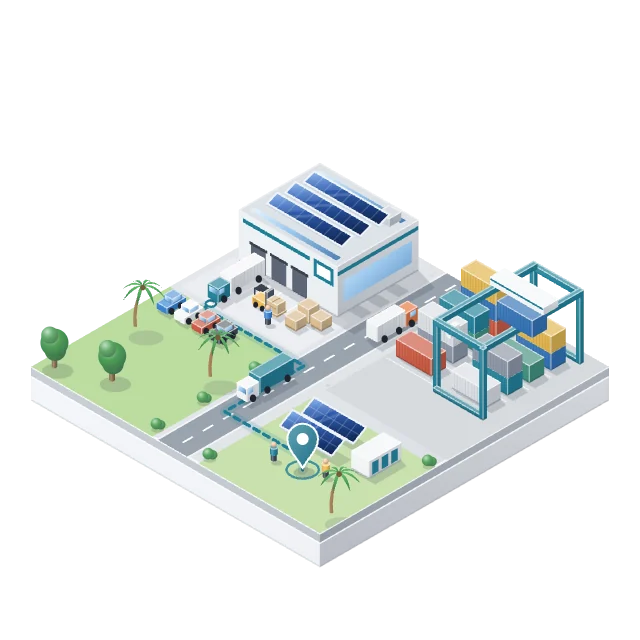
Connectivity & trade
The towers, ports and supply chains a low-carbon economy runs on.
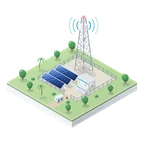
Diesel towers,
ranked for solar.
Find the mobile-network towers running on diesel and rank which ones are worth converting. Each comes with a load profile, a carbon saving and a procurement-ready pack per cluster.
- Tower registry with operator and tower-company attribution
- Twenty-four-hour site load curve and power model
- Diesel-displacement carbon model per site
- Lead clustering and a qualified-lead board
- Tender feed and anomaly detection
Shore power,
berth by berth.
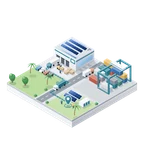
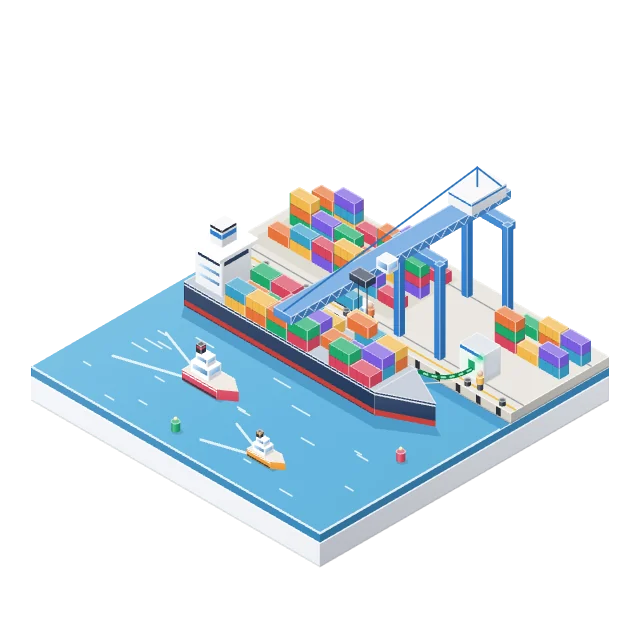
Every port and shipping lane in the country on one map. Work out how hard and expensive it is to reach an island site, then design a shore-power installation for a specific berth with a costed business case.
- Port registry with berth attributes and quay lengths
- Sea-route and freight cost wired straight into project cost
- Weather-window risk from sea state and forecast
- 3D berth twin with equipment placed, sized and exported
- Vessel traffic replay, with modelled patterns clearly labelled
Factory to site,
costed on landing.
The equipment every design calls for, followed from the market to the site: price indices, quotes compared and awarded, the landed cost with its tax stack, the freight lane, the container plan and the shipment.
- Market price indices for modules, batteries, steel and freight
- An equipment catalogue with customs codes and manufacturers
- Request-for-quote comparison and an award recommendation
- Landed cost broken down with the destination tax stack
- Freight lanes, Incoterms, container packing and a shipment timeline
Early access: the China to Indonesia lane first, on indicative prices until supplier agreements are in place.
Intelligence & impact
The layer that runs a fleet, answers questions and keeps every claim honest.
Every site,
one cockpit.
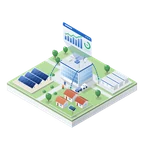
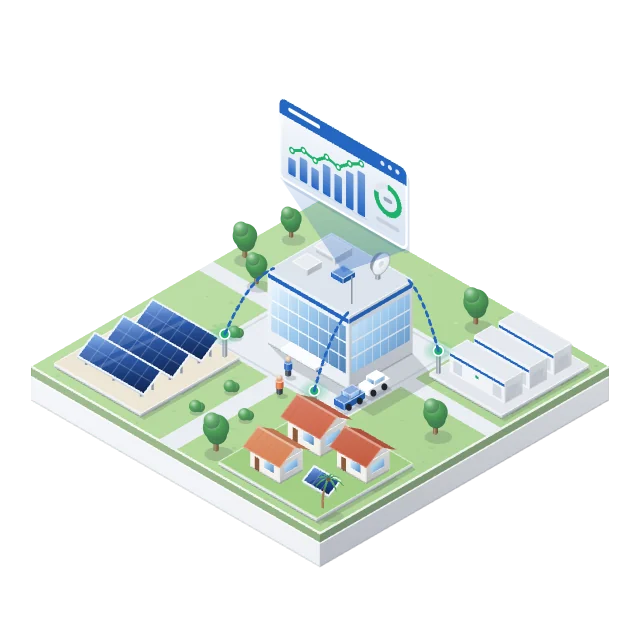
Once the sites are built, they are run from the same place they were designed: generation, storage, load, dispatch and maintenance, with the impact on households and the economics beside them, and every figure tagged with where it came from.
- Generation, battery, load and dispatch for every site
- Maintenance and alarms in one place
- Impact views: households, productive use and carbon
- Economics and value-to-government views
- A 3D plant model with sun playback, and a presenter mode
Early access: shown on a demonstration fleet until your own sites are connected.
Ask the platform.
It answers out loud.
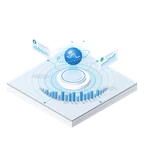
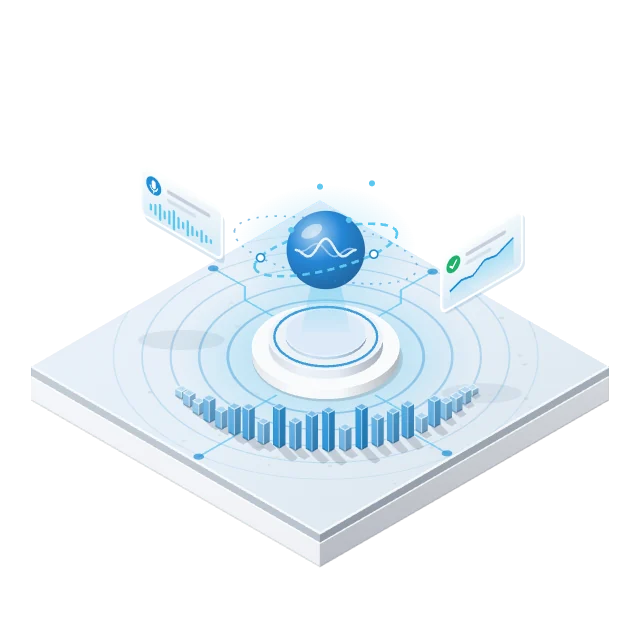
Jarvis is the platform’s voice. Ask it to open a module, fly to a village or explain a number on screen, and it does, then tells you what it found. Speech and reasoning run on Lumen8’s own servers.
- Opens any module, screen or place by voice
- Reads the screen and explains the numbers on it
- Answers from each module’s own data and notes
- Self-hosted speech recognition, reasoning and voice
- Will not press pay, send, export or delete for you
English today.
Count the carbon.
Then check it from orbit.
Every design carries a carbon ledger: the diesel it displaces, the embodied emissions in its modules, steel, batteries and civils, and the year the two cross. After construction the asset is re-observed by satellite so the avoided tonnes are measured, signed and reported, not asserted.
- Avoided emissions per site from the diesel or grid baseline it replaces
- Embodied carbon by component, from the same bill of materials that prices the plant
- Carbon payback year and 25-year net balance on every dossier
- Continuous monitoring: generation, fuel burn and land-use change from satellite passes
- Annual verification report, signed and reproducible, ready for a registry or a lender
Pick the asset class.
The engine does the rest.
Every module is the same core configured for a different kind of site. An engagement on any of them runs the same way.
Name the assets.
A wind resource, a river, a set of villages, farmland, towers, ports or a fleet. Tell us the decision the analysis has to support and who signs it.
You bring · the asset class, the decisionLoad the region.
The national registries are already there for Indonesia. Elsewhere, the module's data layers are loaded for your country, with every source stamped.
You get · your region, screenedRank, design, price.
Every candidate scored on the same basis; the shortlist designed, costed and given a business case. Impact is measured by the twin, not asserted.
You get · packs per site or clusterWalk it through.
A working session with your engineers and, where money is involved, your lender. Then the satellite keeps watching.
You keep · every file, every runWhat people ask
about the modules.
Straight answers, including the ones that say "not yet".
Can we run more than one module on the same sites?
Yes. A port with a tower on it and farmland behind it is one place with three analyses. The modules share the resource, finance, provenance and AI core, so the results sit in the same workspace and the same dossier.
Which modules are production-grade today?
Utility-scale solar and storage, village mini-grids, wind, agriculture, agrivoltaics, telecom towers, ports and shore power, the behavioural twin and Jarvis run end to end, and carbon accounting is live with satellite verification. Hydro, geothermal, supply chain and the portfolio cockpit are early access: they work, on one market or on demonstration data, and are framed that way until they have run on your own sites. Aquaculture and hydroponics are on the roadmap and calculate nothing yet.
How do the modules map to the Sustainable Development Goals?
Each module states the goals it serves, and every result reports against them from the same run that designed and priced the asset. Twelve of the seventeen goals are in scope today, from affordable and clean energy and climate action to zero hunger and life below water. The mapping is ours; the goals are the United Nations’.
Is vessel traffic live?
No, and the product says so on screen. Ports run on traffic replay and observed port calls, labelled live, replay or synthetic by source. A commercial vessel feed is the next data purchase.
How is impact verified?
Every built asset is re-observed by satellite, the twin runs a counterfactual against a placebo test, and every annual result is signed. Gross and attributed figures are reported separately.
One engine. One dataset. Every surface reports the same way.
Which infrastructure is yours?
Tell us the asset class and the geography. We will show the module running on it.