Agrivoltaic design software

The field beneath the array

The light, the crop, the water and the money under a solar array, modelled hour by hour before a single post goes in.

§ 0.1 · Days 0 to 40

Every plant starts equal

Same seed, same soil, same water. The one thing the array changes is light: the module edges and the posts take a different share of sun from every square metre, every hour.

Ground light under the array, now—
§ 0.2 · Days 40 to 80

Where the light is lower, the canopy closes later

Plants in the least-lit third grow on a slower clock. The model follows that square metre by square metre, because a crop answers to the light it receives, not to the field average.

Canopy, least-lit third—Open field—
§ 0.3 · Days 80 to 120

At harvest, the difference is a number

Crop under the array as a share of open field is one half of the land equivalent ratio. The kilowatt-hours are the other half. The studio computes both, every hour, for 25 years.

Season light, array ÷ open—Day—
01The problem

Solar and farming compete for the same land. What decides the outcome is how much light each receives, hour by hour, over twenty-five years.

PV toolGISSpreadsheetFAO-56 sheetLER templateOne model
8,760Hours simulated in every run
35Crops with sourced parameters
12Compliance regimes screened
02The model

One chain, from the sky to the balance sheet

Five models run for every hour of the year, each handing its answer to the next. You set the site, the crop and the structure; the studio does the rest.

  1. 2.1 · SkyWeather to usable light

    Fifteen years of hourly weather, turned into the light a leaf can actually use.

    OutUsable light, every hour
  2. 2.2 · LightLight under the array

    How much sun and sky each patch of ground keeps once the modules are overhead.

    OutA light map of the whole site
  3. 2.3 · CropLight into harvest

    Day by day, the crop turns the light it receives into growth, held back by heat and dry spells.

    OutYield under the array
  4. 2.4 · WaterWater the crop needs

    Rain, shade and evaporation, tracked through the root zone every day of the season.

    OutIrrigation per season
  5. 2.5 · LandTwo harvests, one answer

    Food and power from the same land, set against growing or generating on their own.

    OutLand equivalent ratio
03The instrument

Ground light across the whole field, month by month

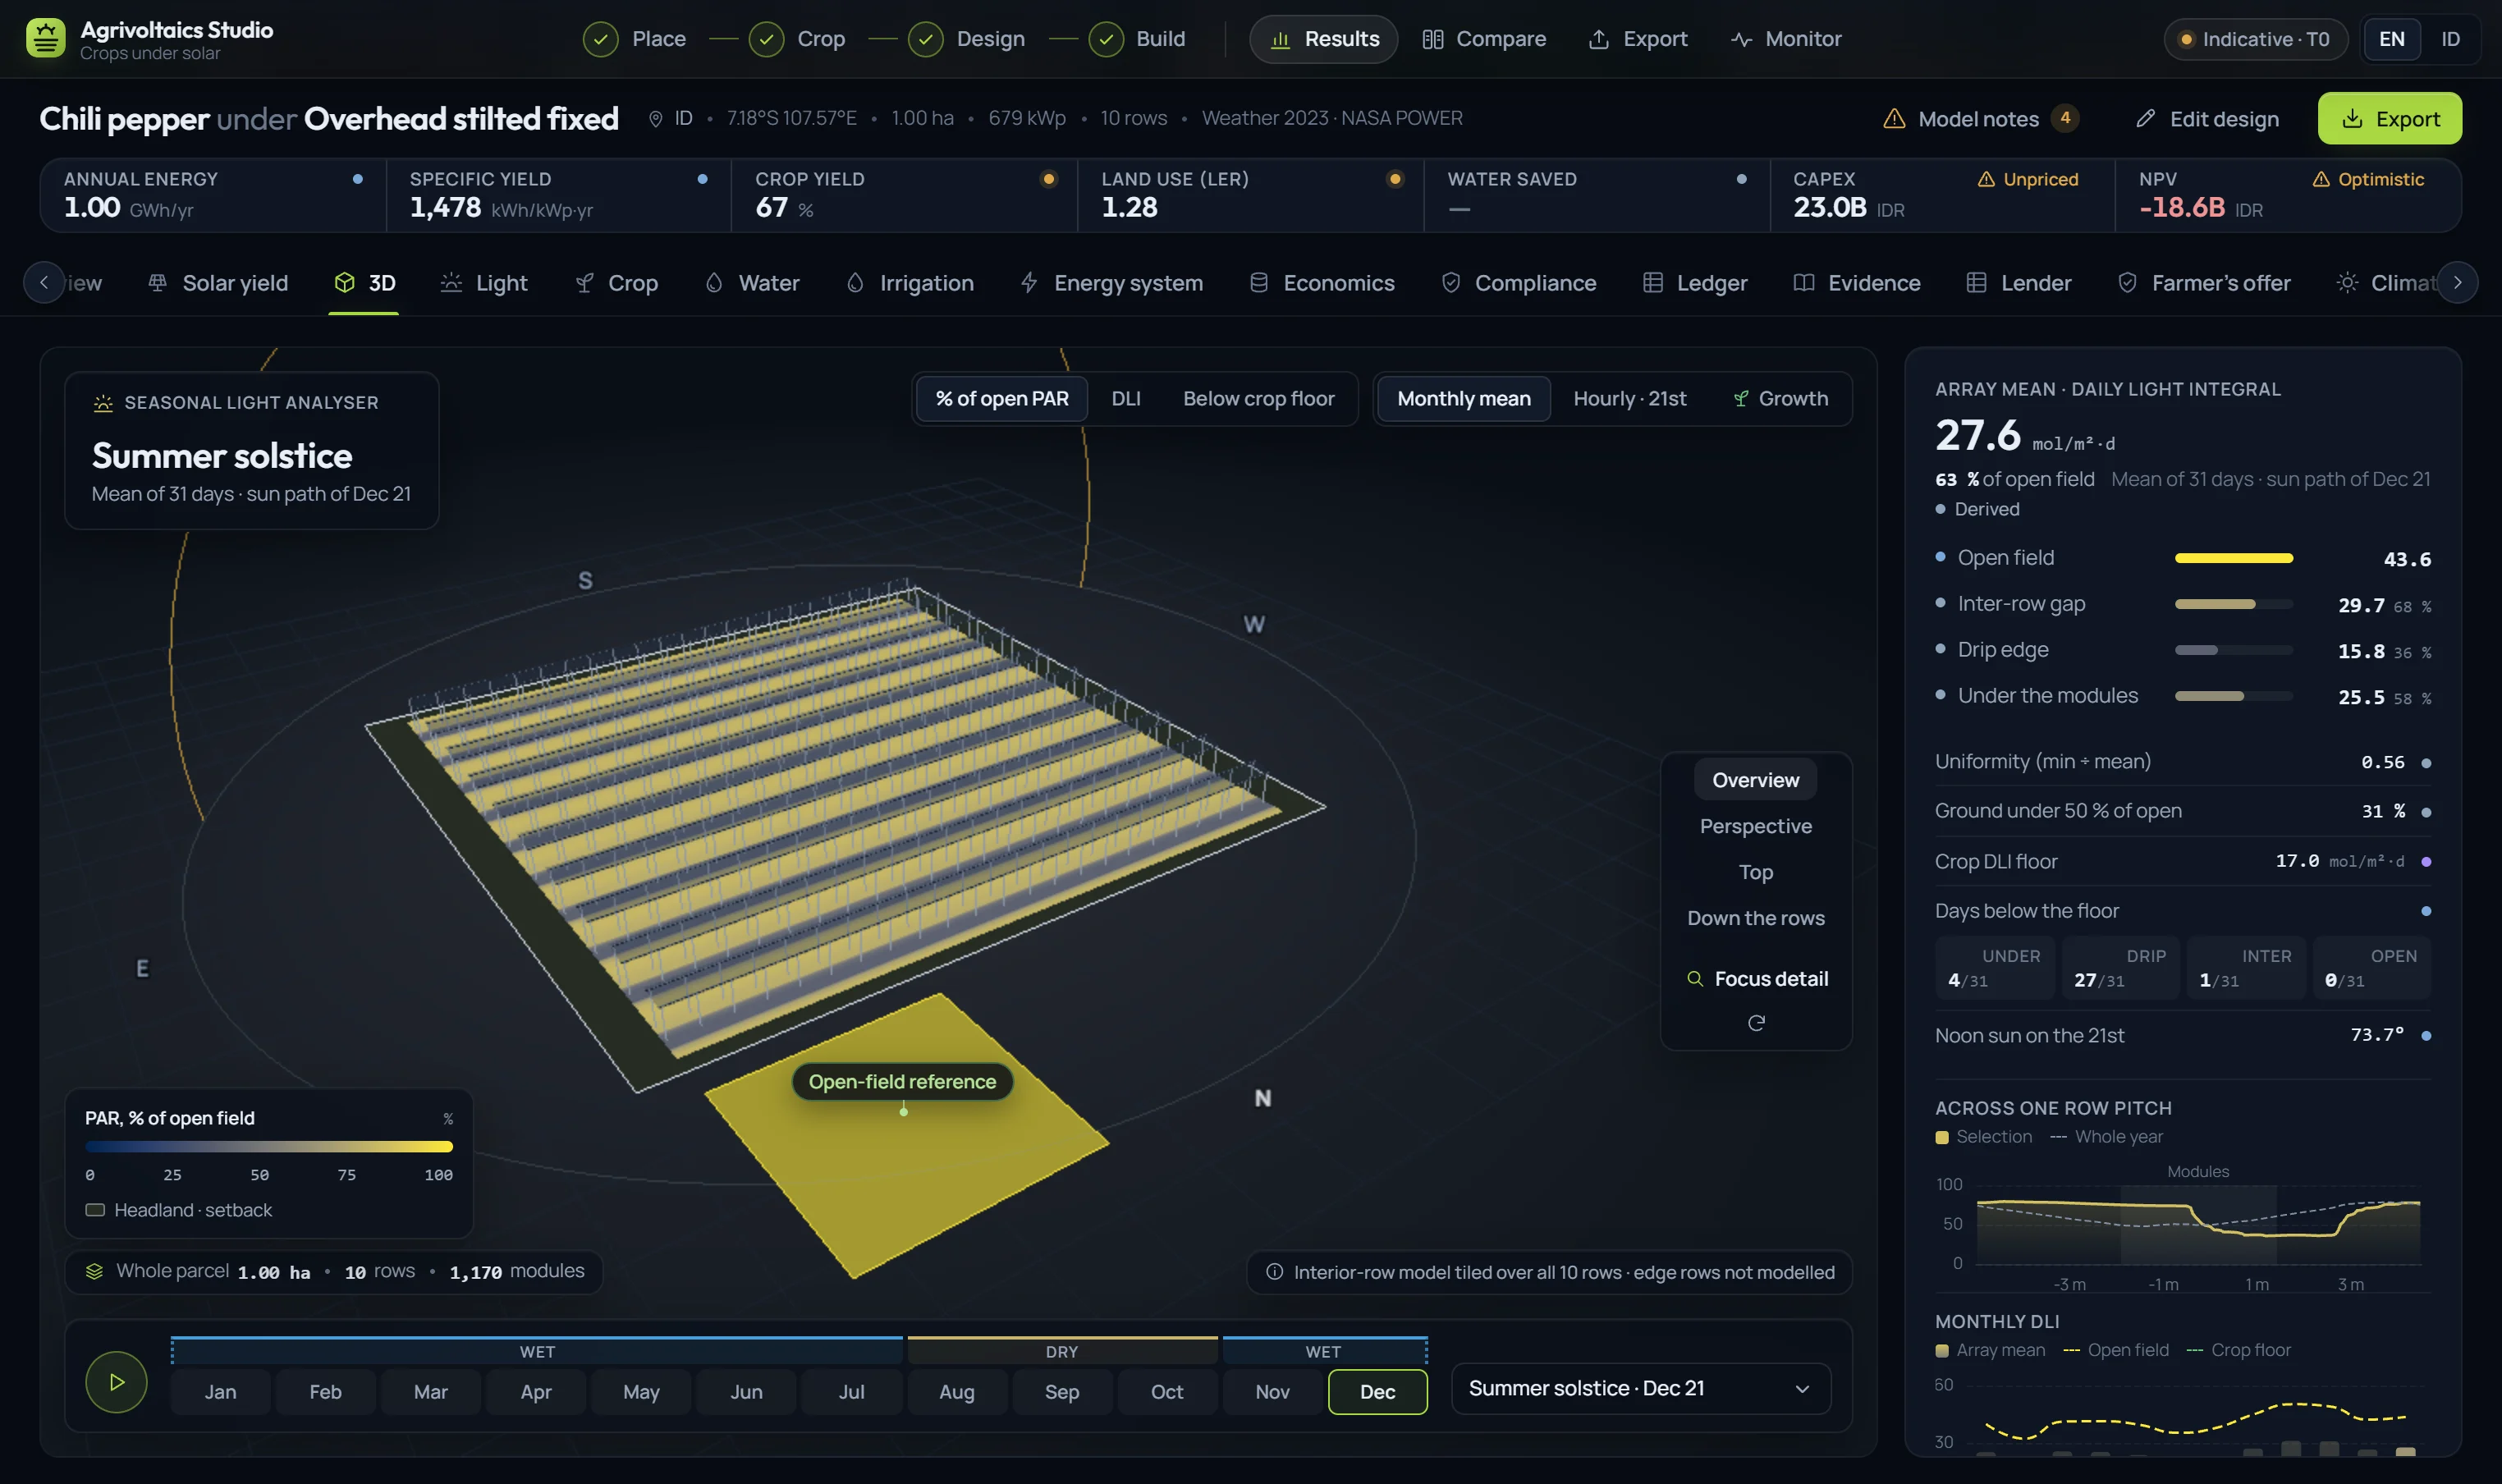
Fig. 1 · 3D seasonal light analyserReal product screen · chili under archetype A · West Java
The studio's 3D seasonal light analyser: a chili site under an overhead stilted array in West Java, with ground light under and between the rows shown as a share of the open field, an open-field reference plot, and a timeline of months.
1Season or hour

Ground light by month, by season, or hour by hour on a representative day.

2Three readings

Share of open-field light, daily light integral, or days below the crop's own floor.

3Open-field reference

A control plot beside the array, so every number has something to be measured against.

4A year in a strip

Press play and the year runs month by month, with wet and dry seasons marked.

5It says what it leaves out

"Edge rows not modelled" is printed on the screen, not hidden in a manual.

04What it computes

What a single run computes

04.1 · Light

The light under the modules, against the crop's floor

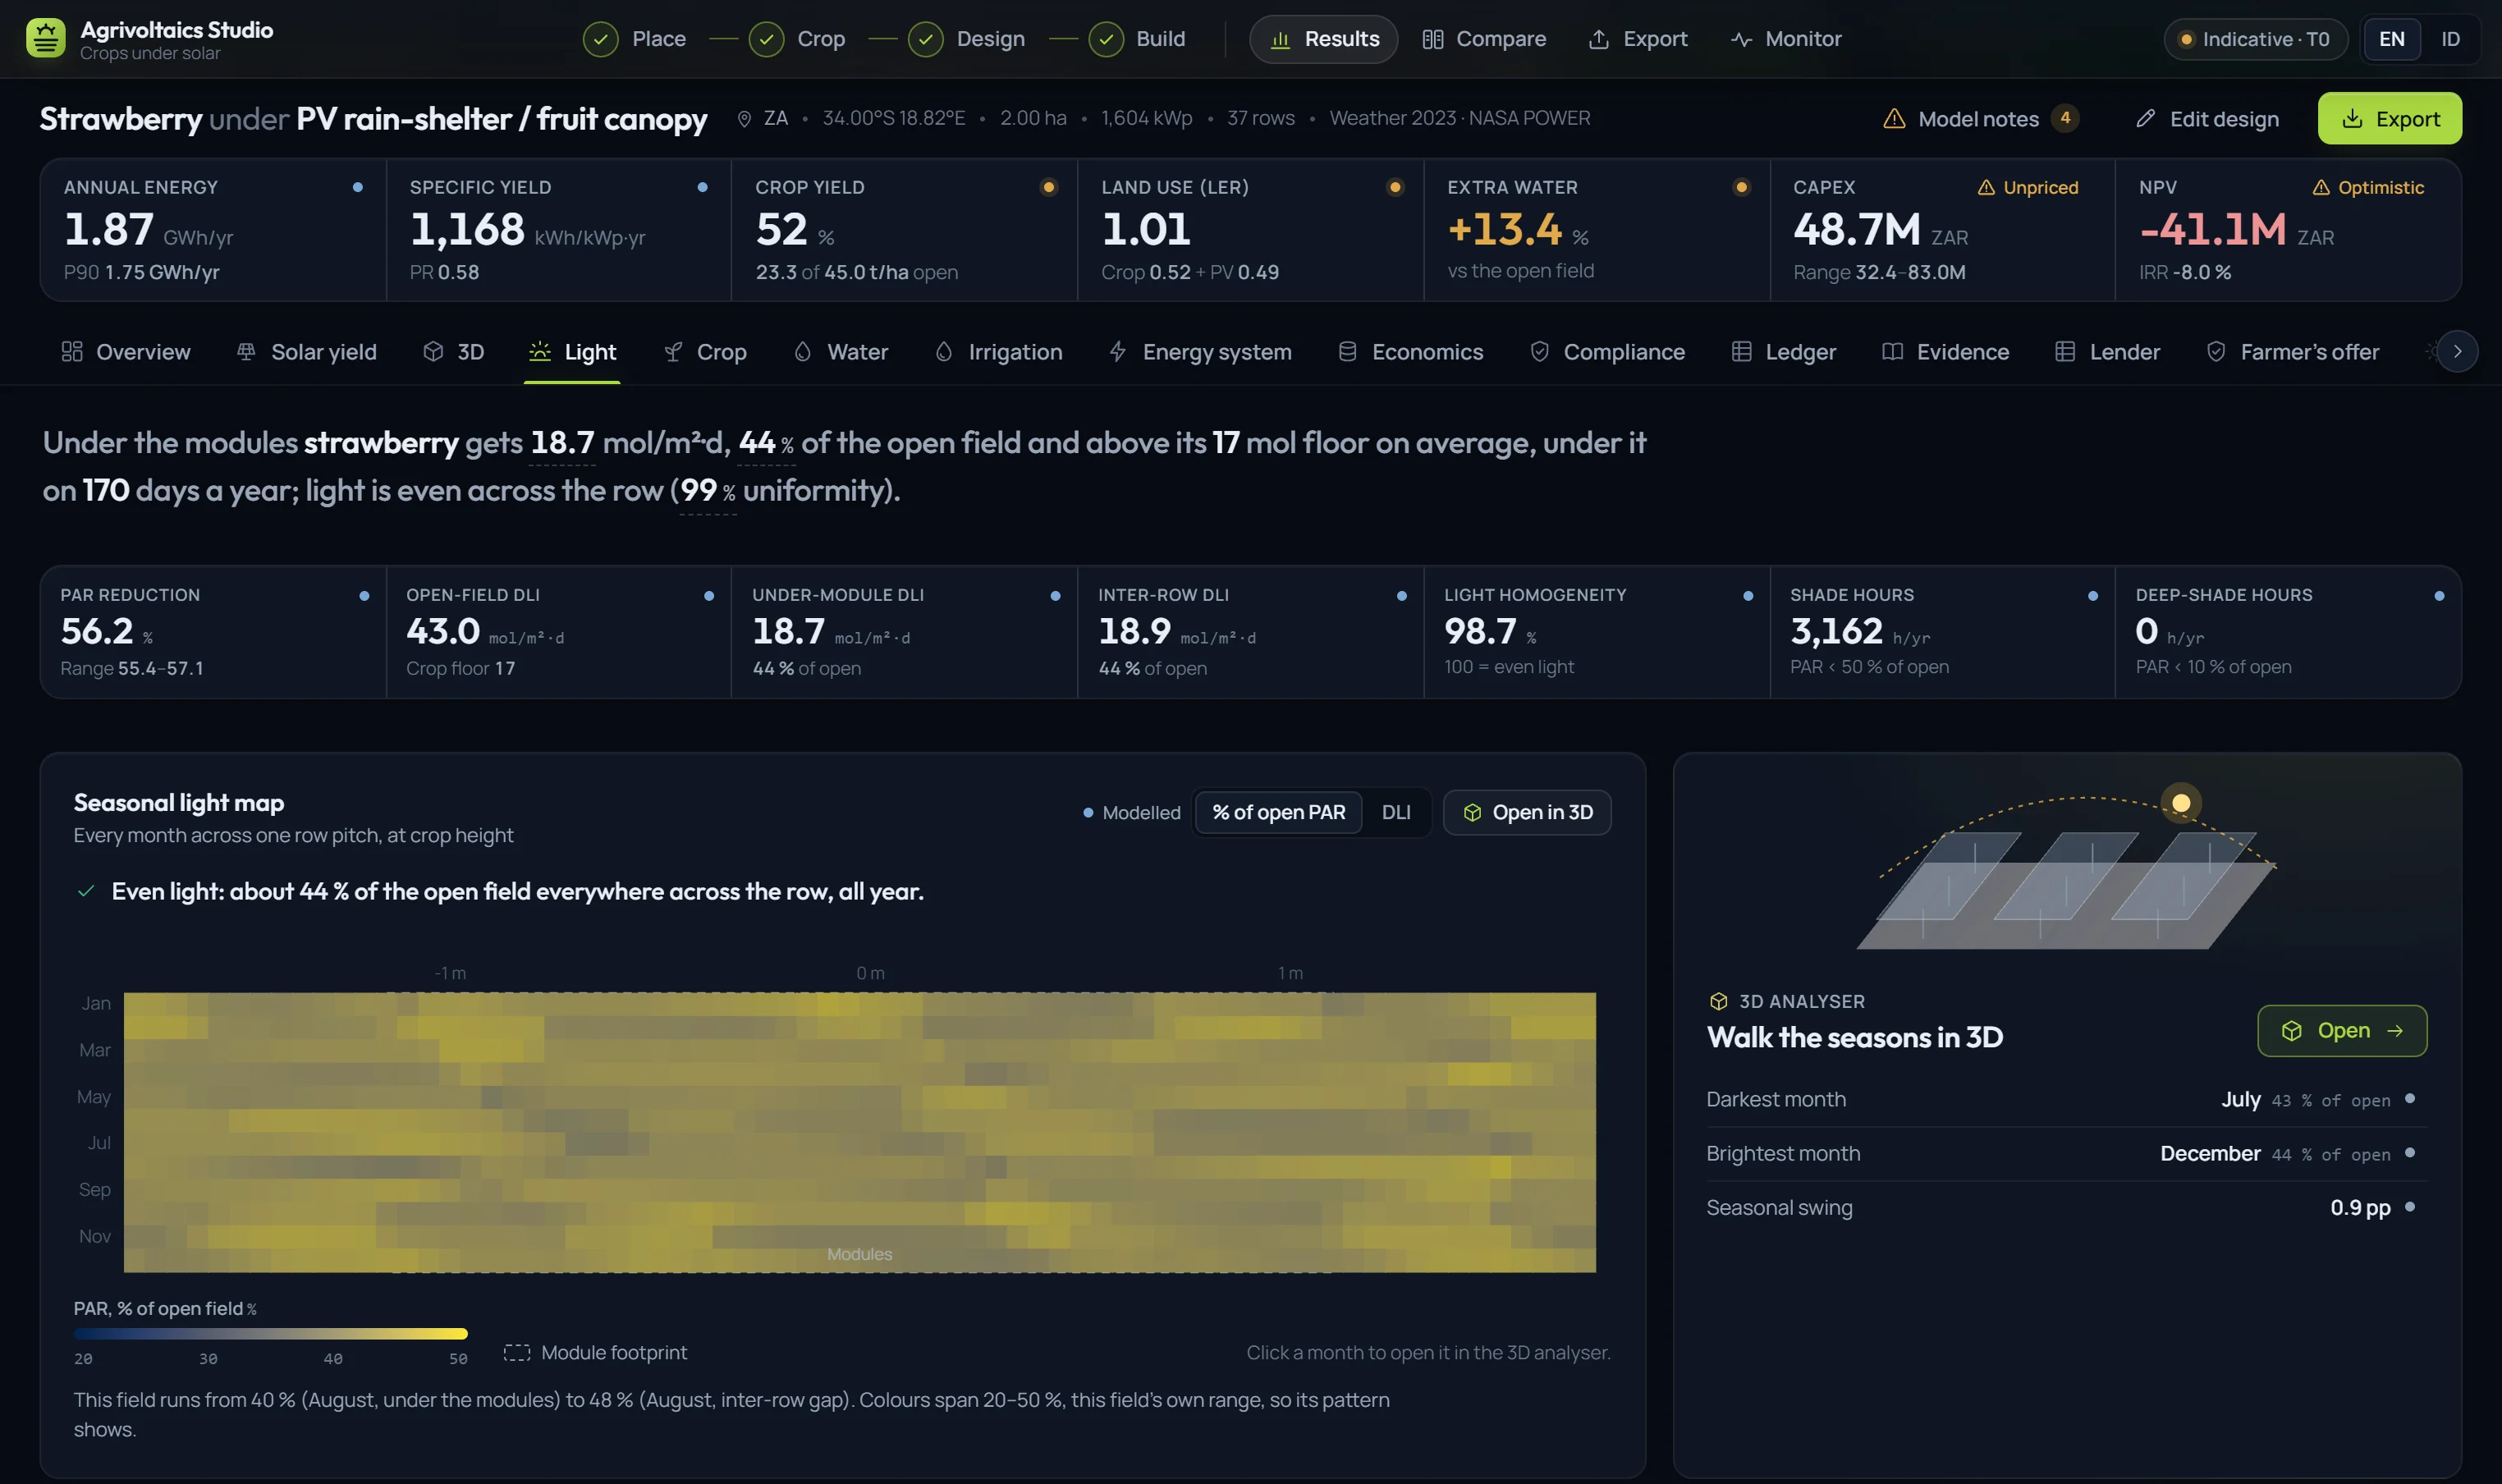
A seasonal map across one row pitch shows where and when the shade bites, and counts the days a year the crop sits below the light it needs.

Daily light integral
under · between · open
Light homogeneity
% across the row
Shade hours
h / yr
Light and energy
Seasonal light map: share of open-field light across one row pitch for every month of the year.
Fig. 2 · Seasonal light map · strawberries under archetype E · Stellenbosch
04.2 · Structure

Five structures, ranked for your crop

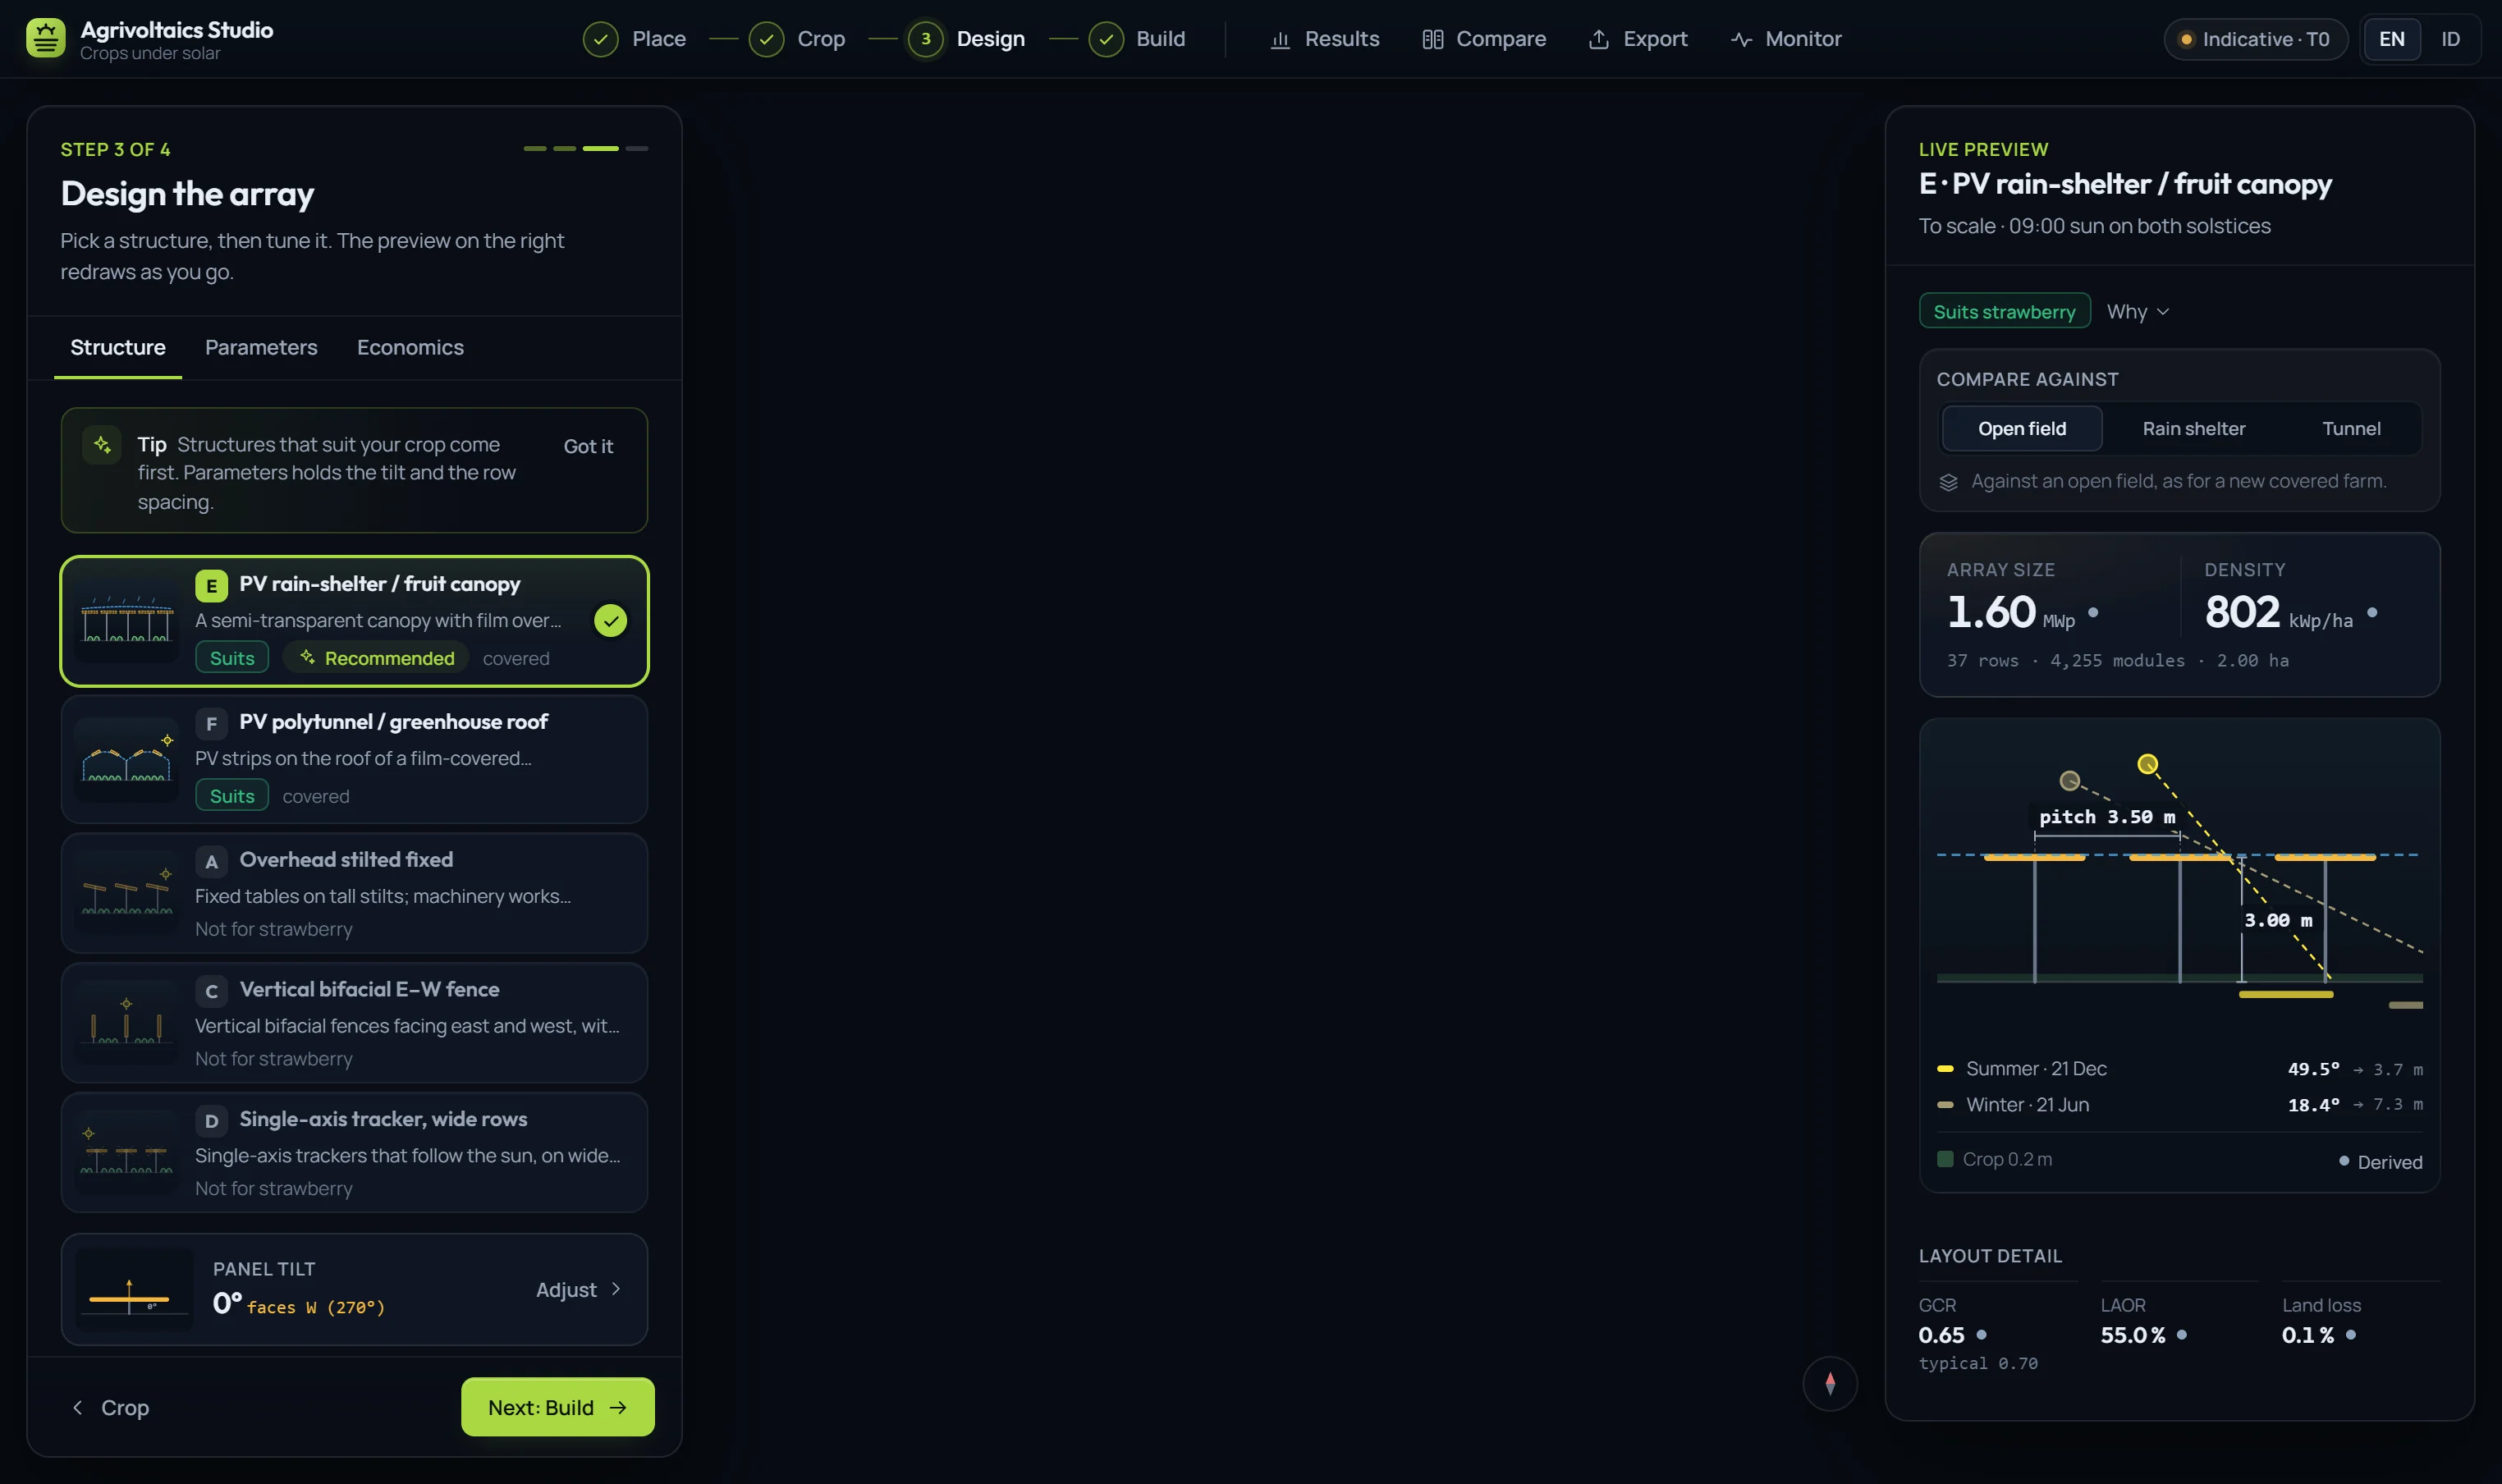
Pick an archetype and a to-scale preview redraws the shadow at both solstices. Each card says whether it suits the crop you chose.

Archetypes
A · C · D · E · F
Suitability
suits · conditional · unsuitable
Preview
solstice sun, shadow reach
The five archetypes
Design step, left panel: five structure cards ranked for strawberry, each with a suitability badge.
Design step, live preview: the PV rain-shelter drawn to scale with the summer and winter sun angles and how far the shadow reaches.
Fig. 3 · Design step · structure cards (left) and the live to-scale preview (right)
04.3 · Water

A drip layout, derived from the rows

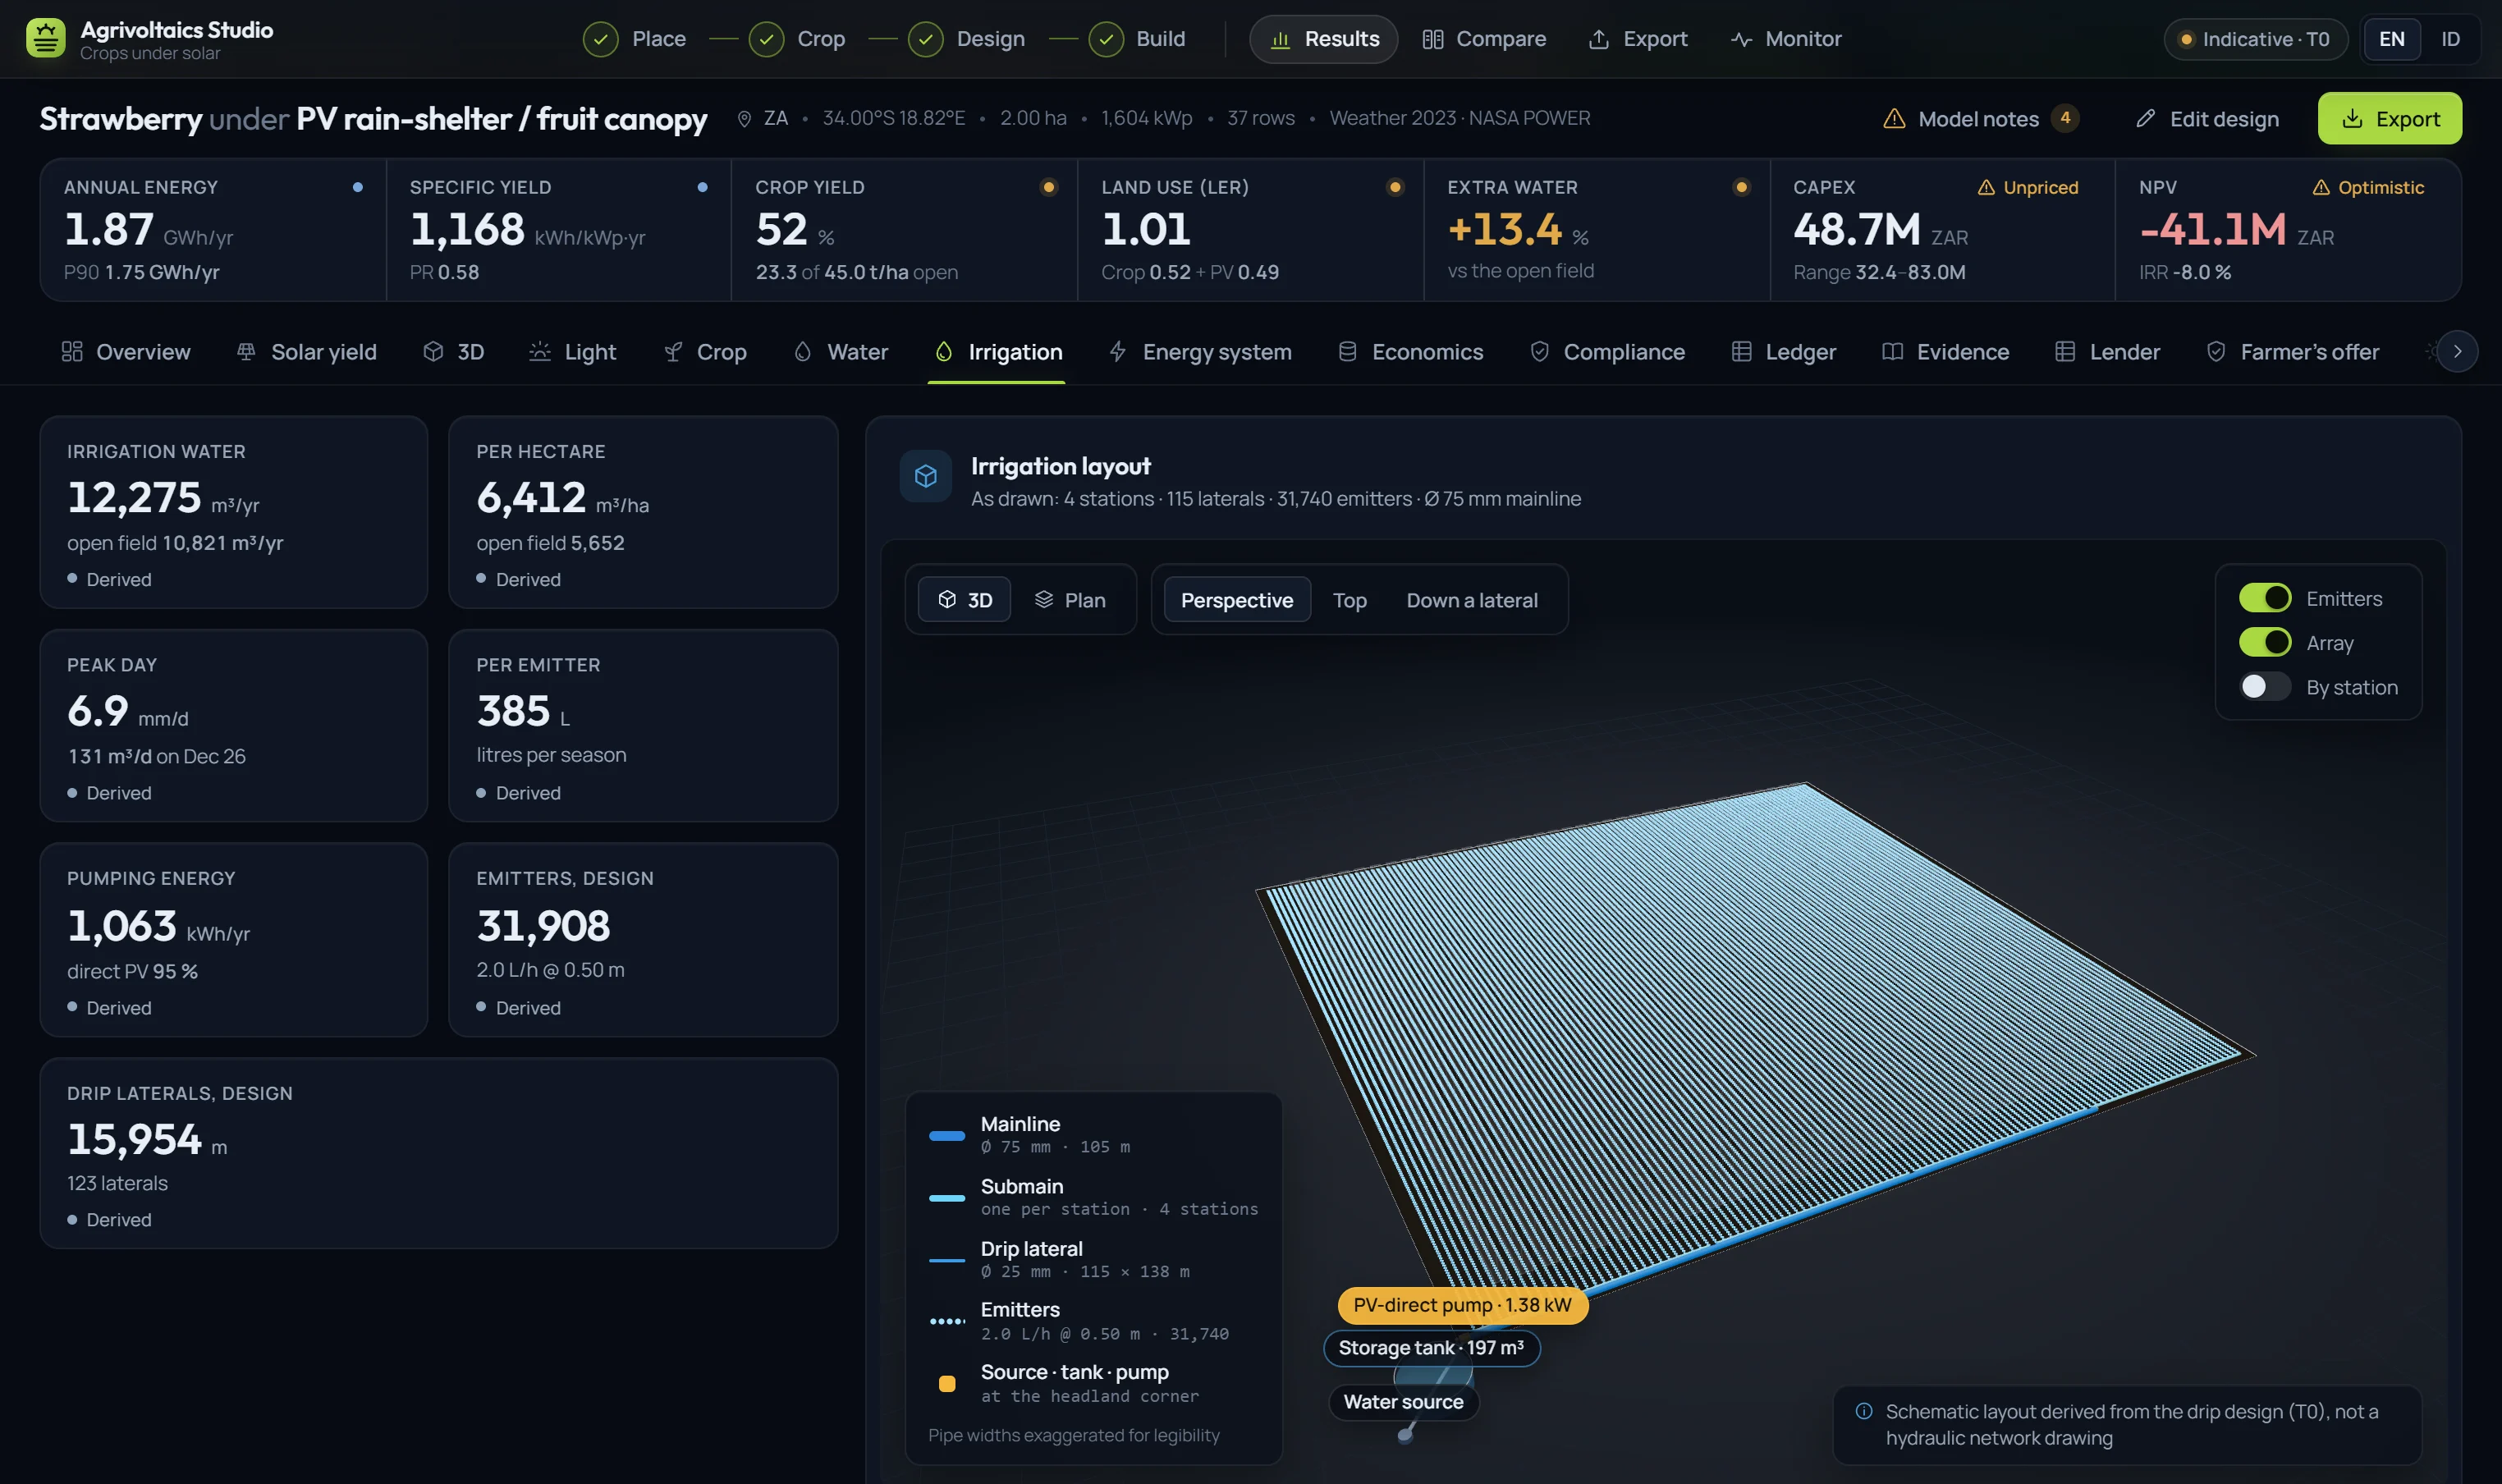
How much water the crop needs under the array, then laterals, emitters, mainline, tank and a PV-direct pump drawn across the parcel. A schematic, and labelled as one.

Irrigation
m³ / yr · m³ / ha
Peak day
mm / d
Pumping energy
kWh · direct-PV share
Water and irrigation
Irrigation layout in 3D: 115 drip laterals across the parcel, mainline, storage tank, water source and PV-direct pump.
Fig. 4 · Irrigation layout · 115 laterals · 31,740 emitters
04.4 · Money

The question a bank actually asks

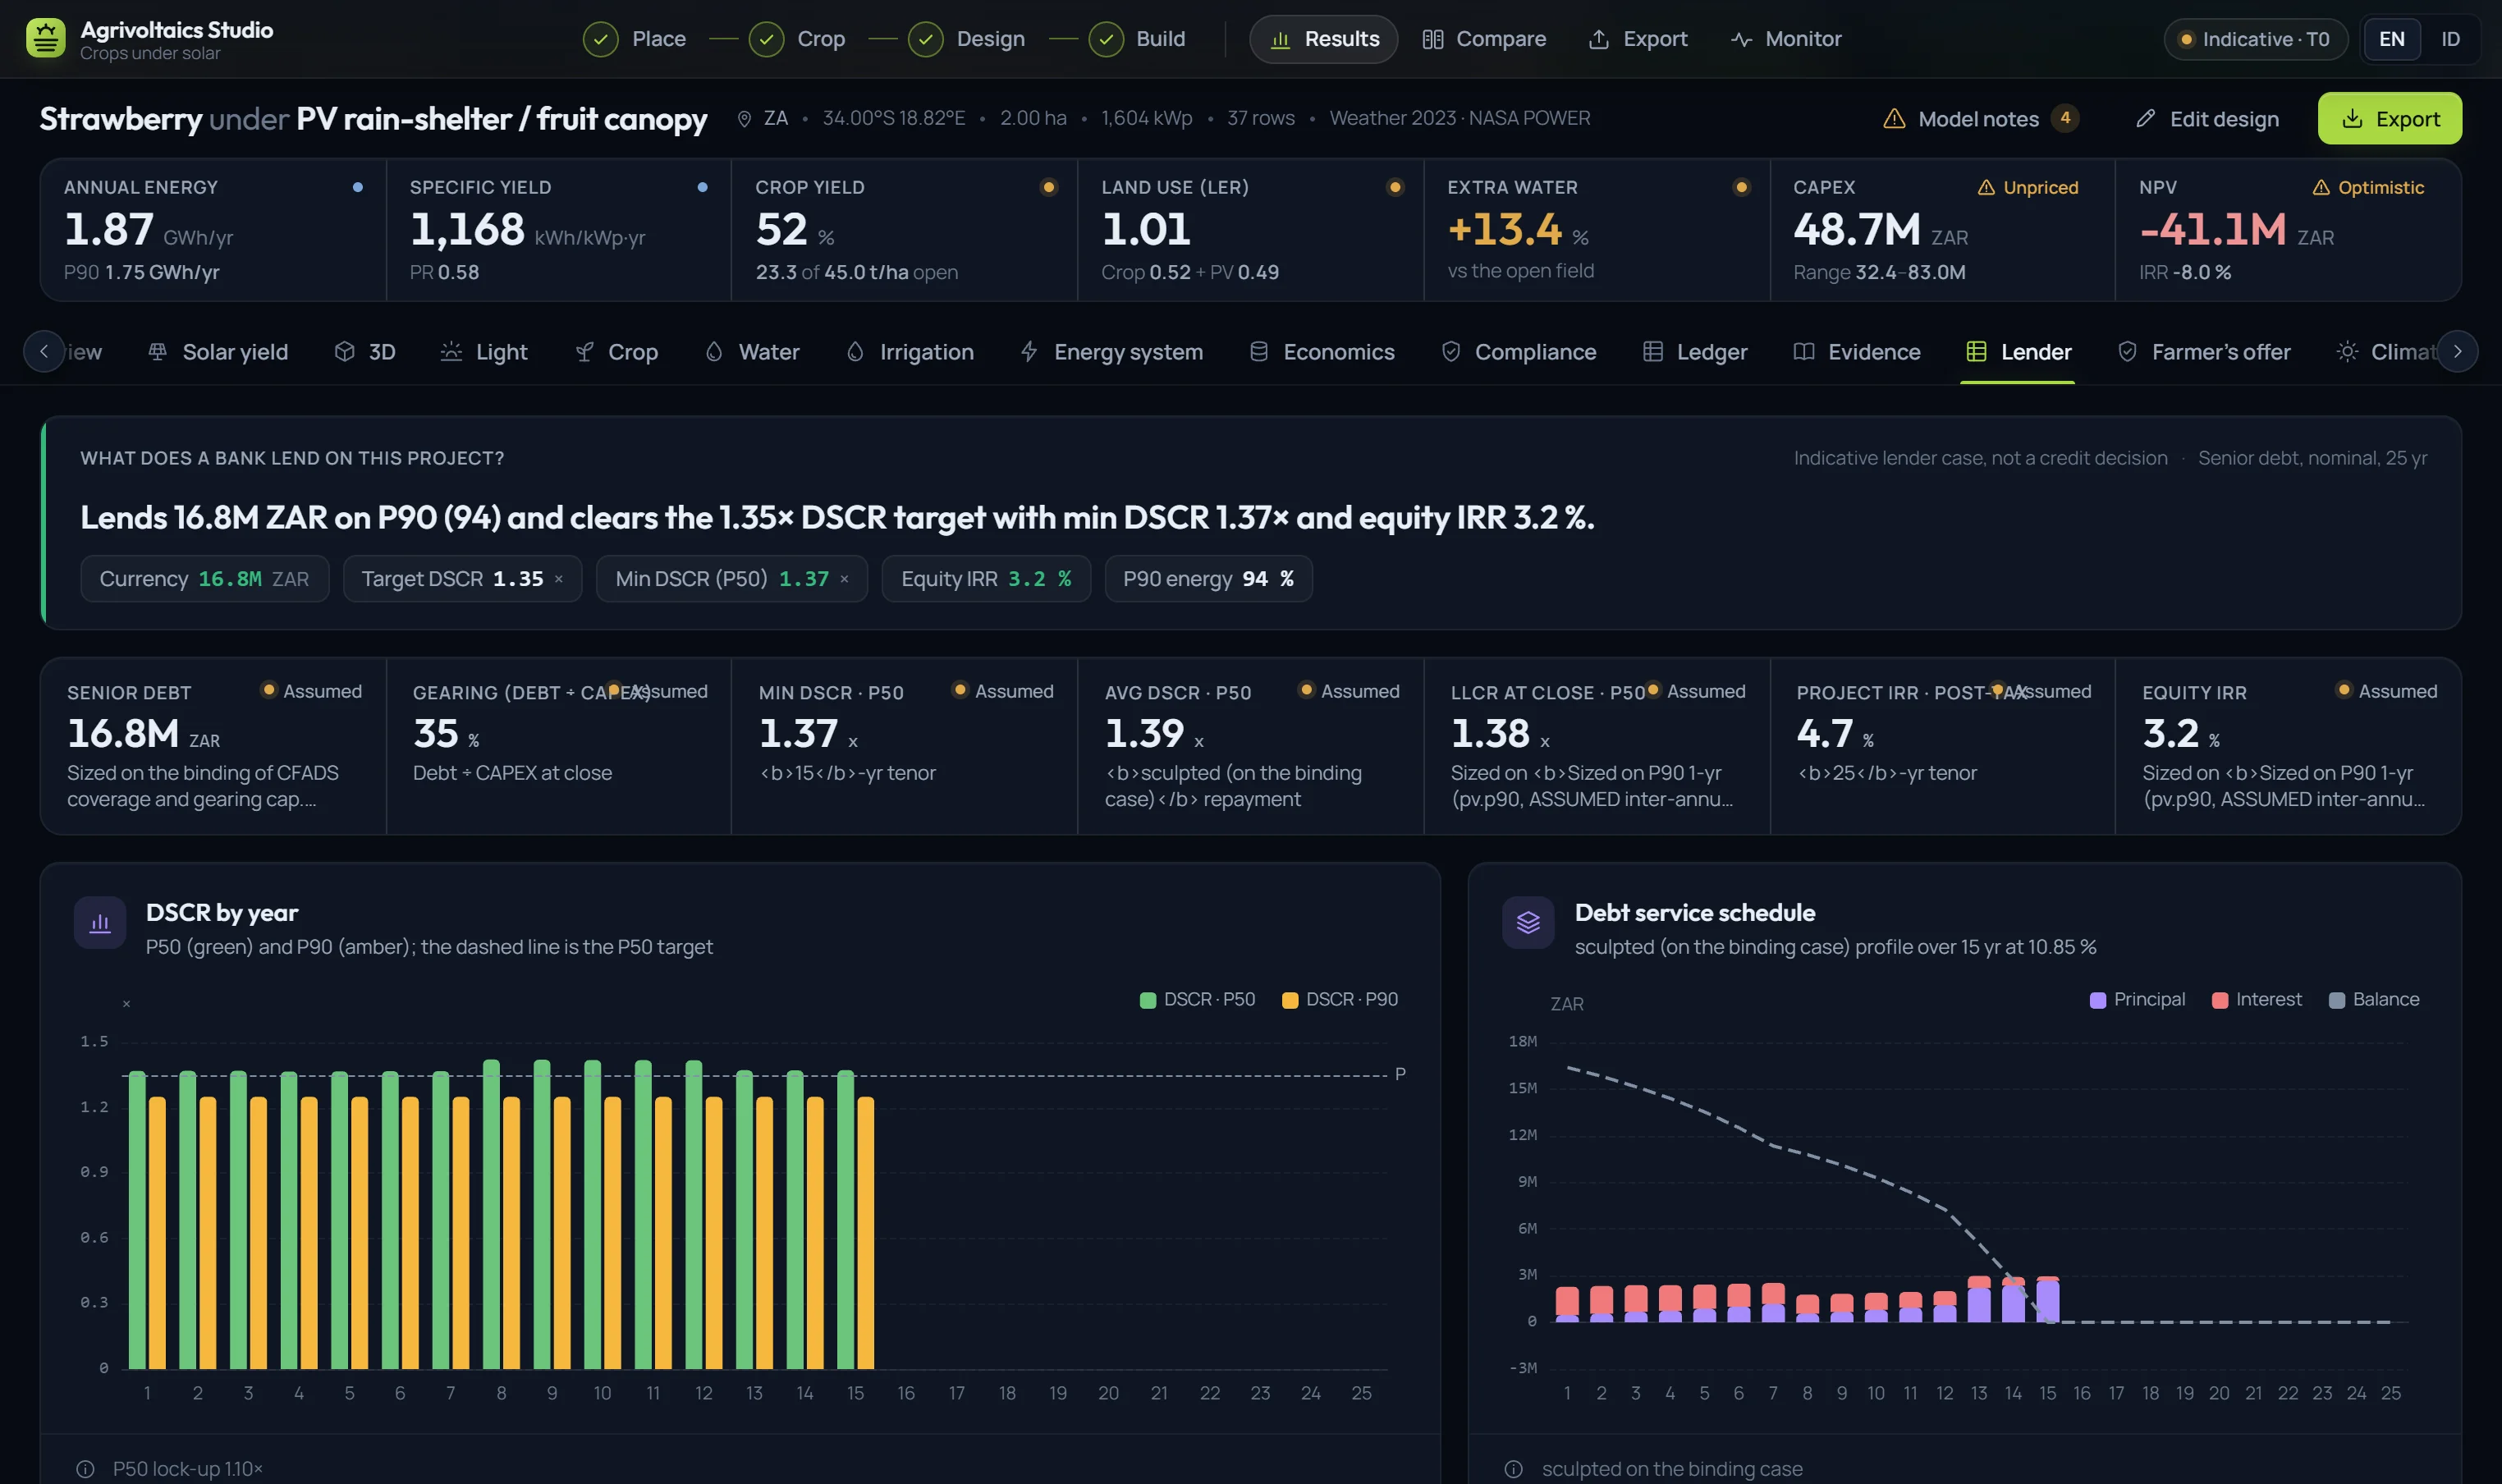
Debt sized on P90 energy, DSCR year by year, sculpted repayment and an Excel model with live formulas, next to NPV, IRR and a farmer–developer offer.

Lends 16.8M ZAR on P90 and clears the 1.35× DSCR target with min DSCR 1.37×.The Lender tab's own answer · demo run · indicative, not a credit decision
Finance, lender and deal
DSCR by year at P50 and P90 against the target line, from the Lender tab.
Fig. 5 · DSCR by year · P50 and P90 against target
04.5 · Rules

Screened against the rules that apply, with the clause

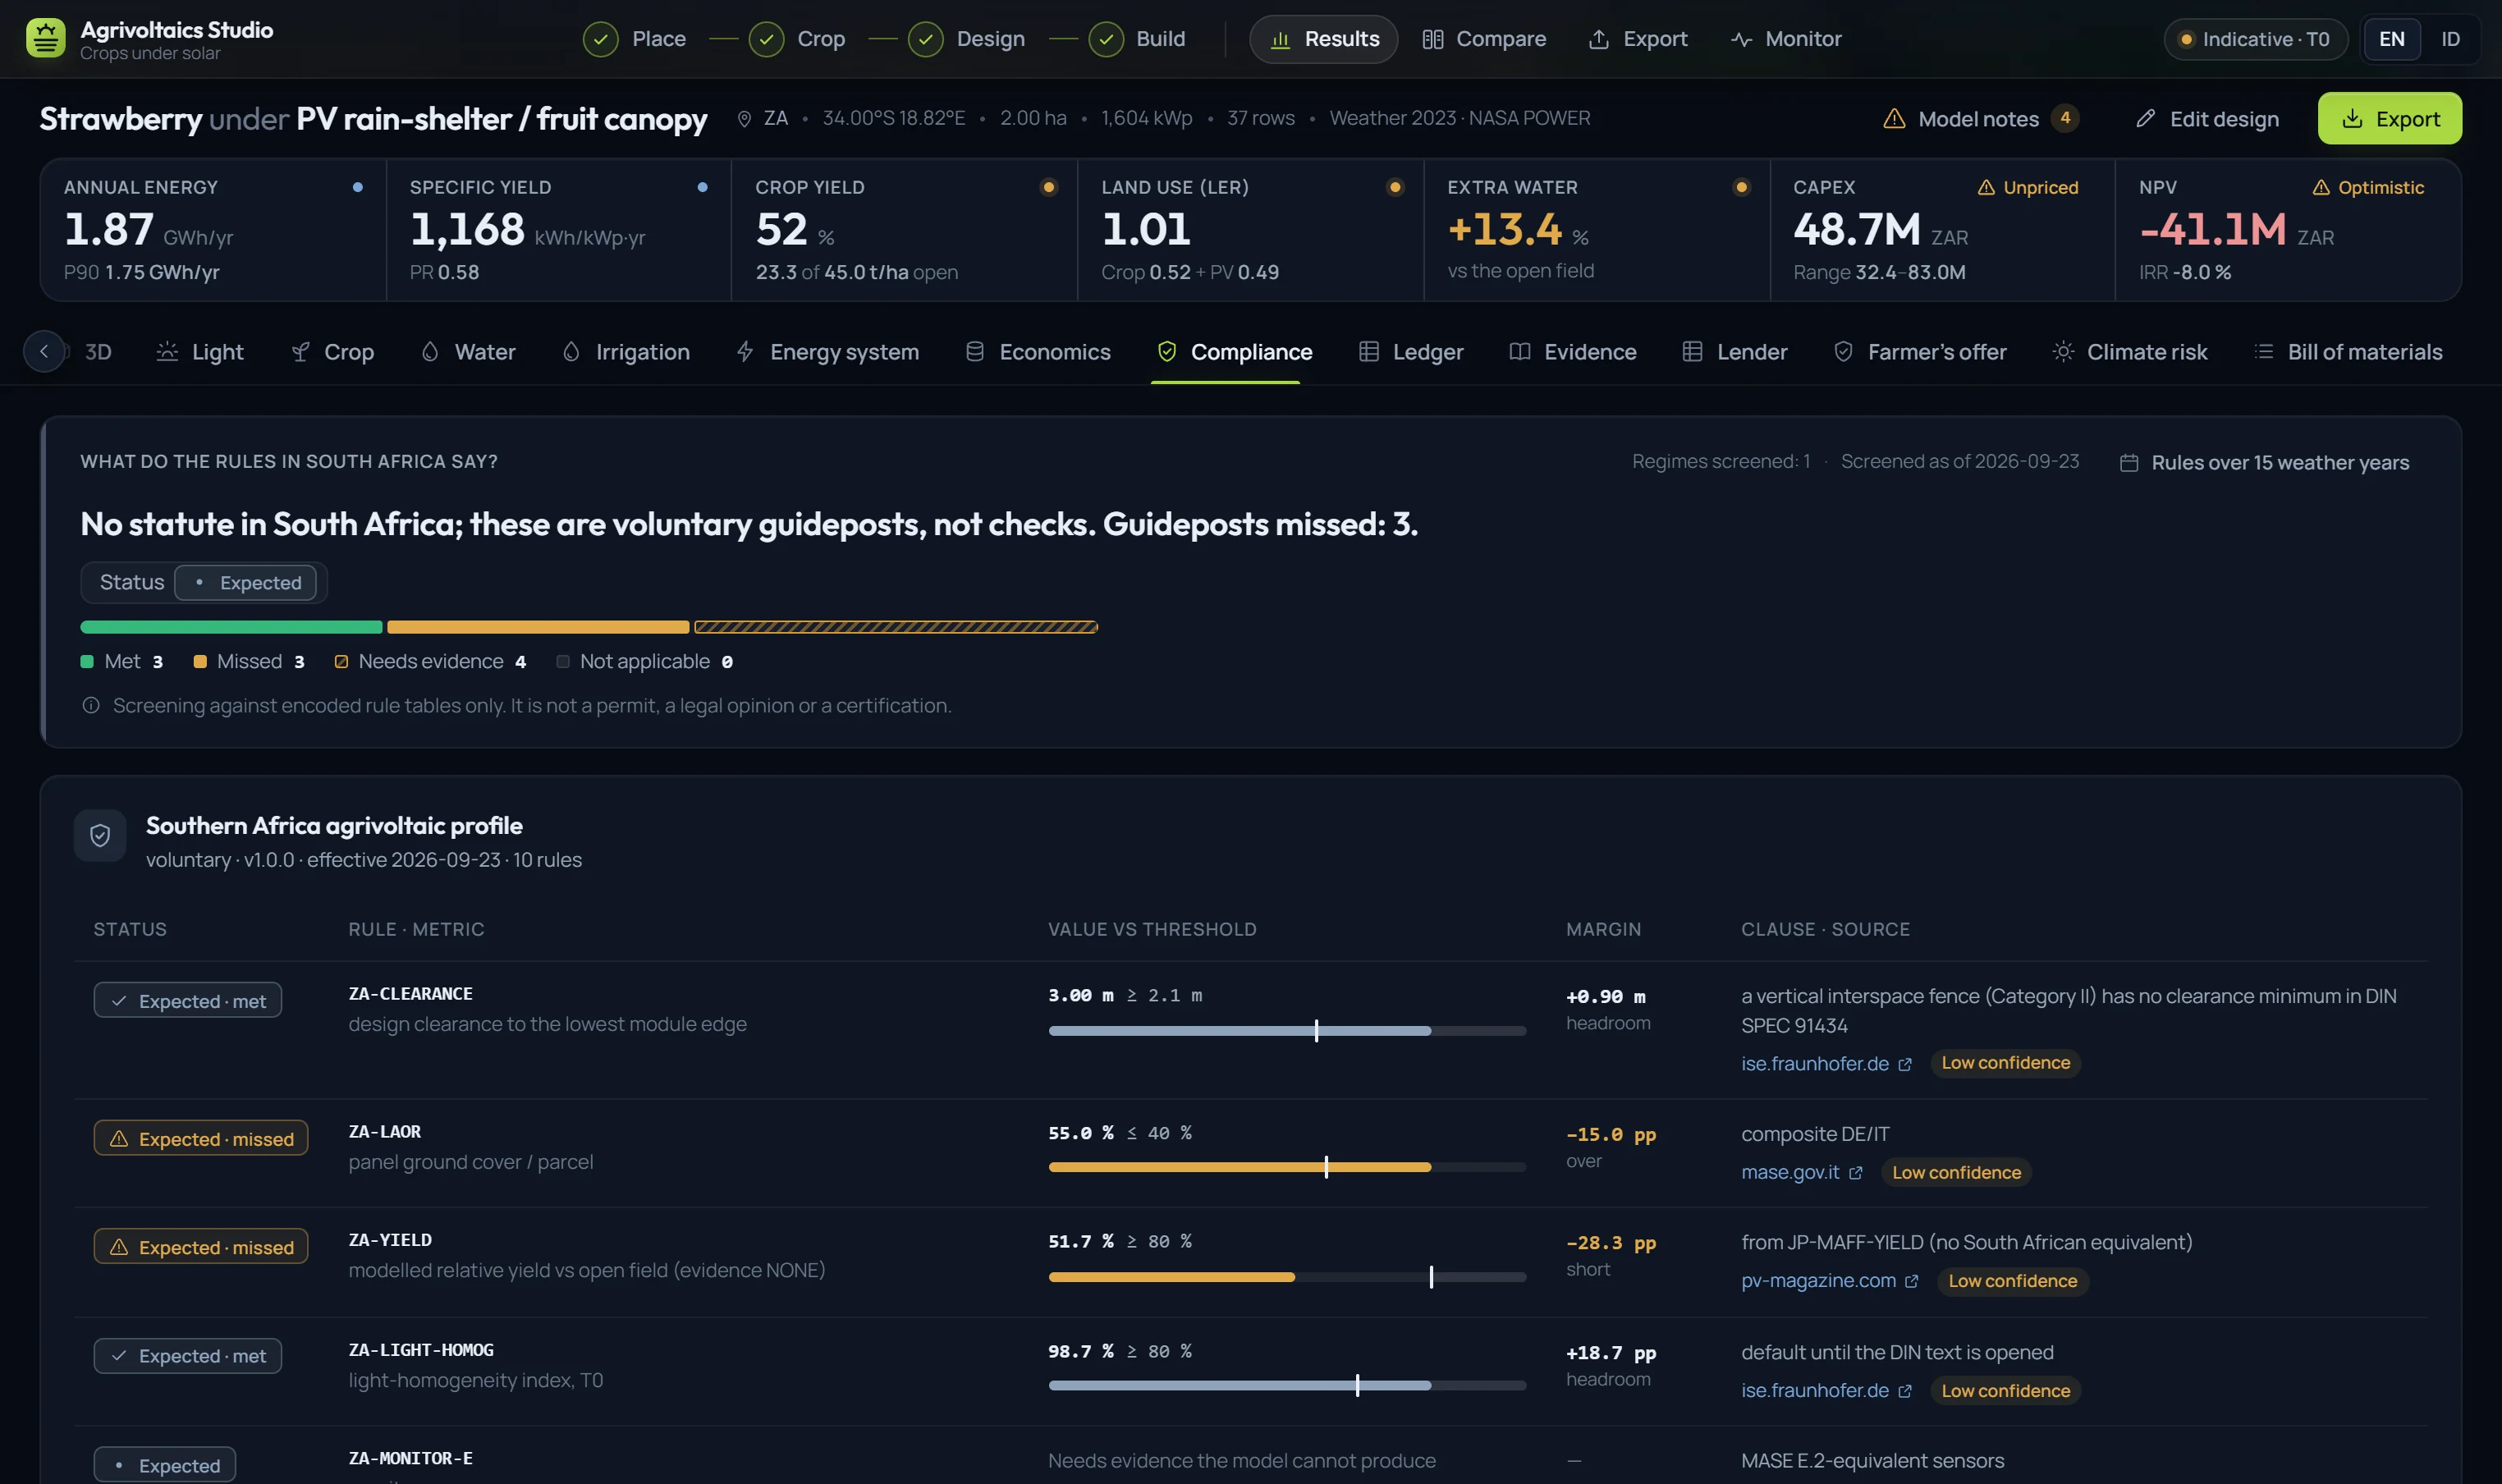
Twelve regimes across Germany, France, Italy, Japan and the United States, plus voluntary profiles where no statute exists. Every rule shows its metric, threshold, margin and source.

Statutory
9 regimes
Draft · voluntary
1 · 2
Output
screening, not a permit
All twelve regimes
Compliance tab: South Africa has no statute, so the voluntary profile is screened rule by rule with value against threshold, margin and source.
Fig. 6 · Southern Africa voluntary profile · rule by rule
05The trade-off

Tilt is a trade between kilowatt-hours and kilograms

A single-axis tracker, drawn to scale. Follow the sun for energy, or turn the modules away at midday and give the light back to the crop. The readout shows what each choice costs.

Fig. 7 · Light under a tracker arrayIllustrative model · drag the time, change the policy
06Proof, not promises

Every number carries its basis

  1. Click any numberIts value, band, basis (modelled, derived, assumed or your input), note and sources open beside it.
  2. Evidence grades on every cropStrong, moderate, low or none. A crop with no evidence is refused rather than estimated.
  3. Weather bandsFifteen real weather years give P10, P50 and P90 for energy, crop, land use, NPV and water.
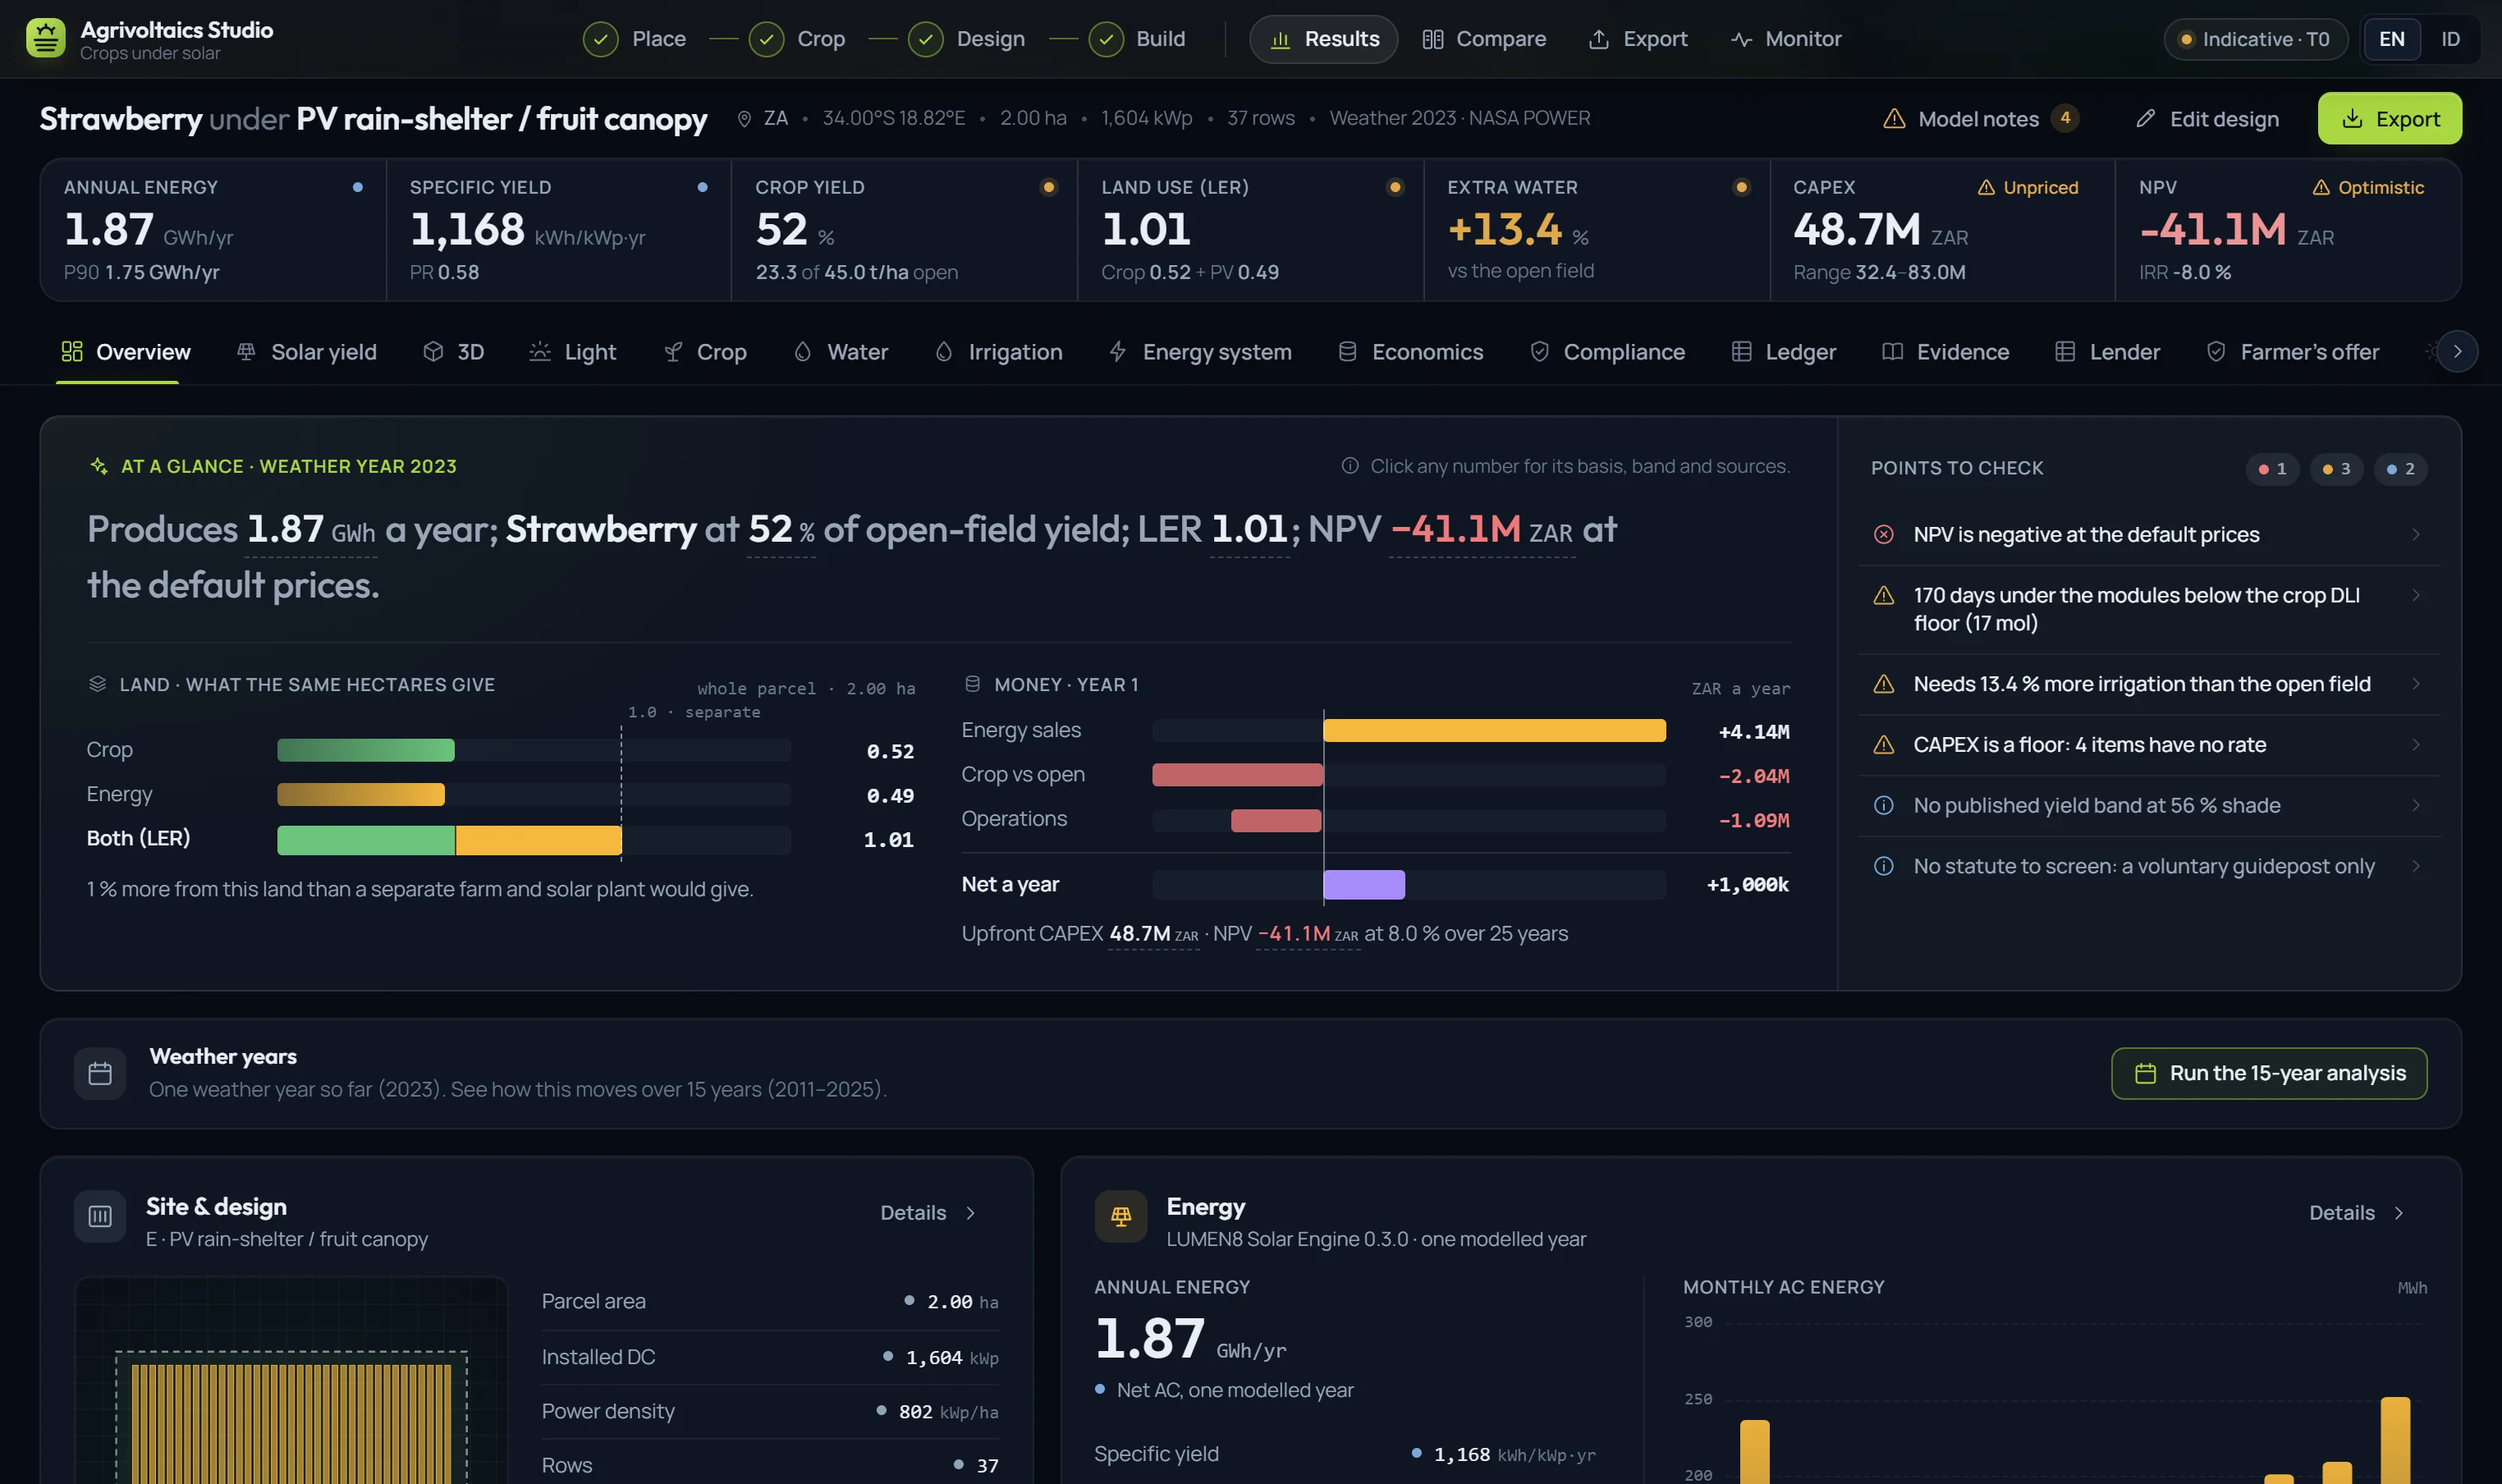
  4. Problems listed firstThe overview leads with the points a reviewer should check, including a negative NPV when the prices say so.
Points to check on the overview: NPV is negative at the default prices, days below the crop light floor, extra irrigation needed, CAPEX is a floor with unpriced items, no published yield band at this shade, and no statute to screen.
Fig. 8 · Points to check · the overview's first screen

Every result is stamped "Indicative · T0" until a hosted ray-traced tier exists. Nothing on this site is a bankable result.

07Where we start
First

Indonesia

A Bahasa Indonesia interface, IDR throughout, regional crop prices and yields, and a voluntary South-East Asia profile with permitting checklists.

Second

South Africa

Strawberries under tunnels, ZAR throughout, and a voluntary Southern Africa profile where no agrivoltaic statute exists yet.

Private preview

Bring us a site

We run your parcel from boundary to dossier: structure, crop, light, water and money, in one sitting.